Transcriptome and functional analyses of phenotypic plasticity in sea grape Caulerpa okamurae
Kang J, Kwak YS, Kim E, Gwon Y, Choi HG, Eyun S
Physiologia Plantarum 176:e14339

— Figures and Tables (Colored and High resolution) —
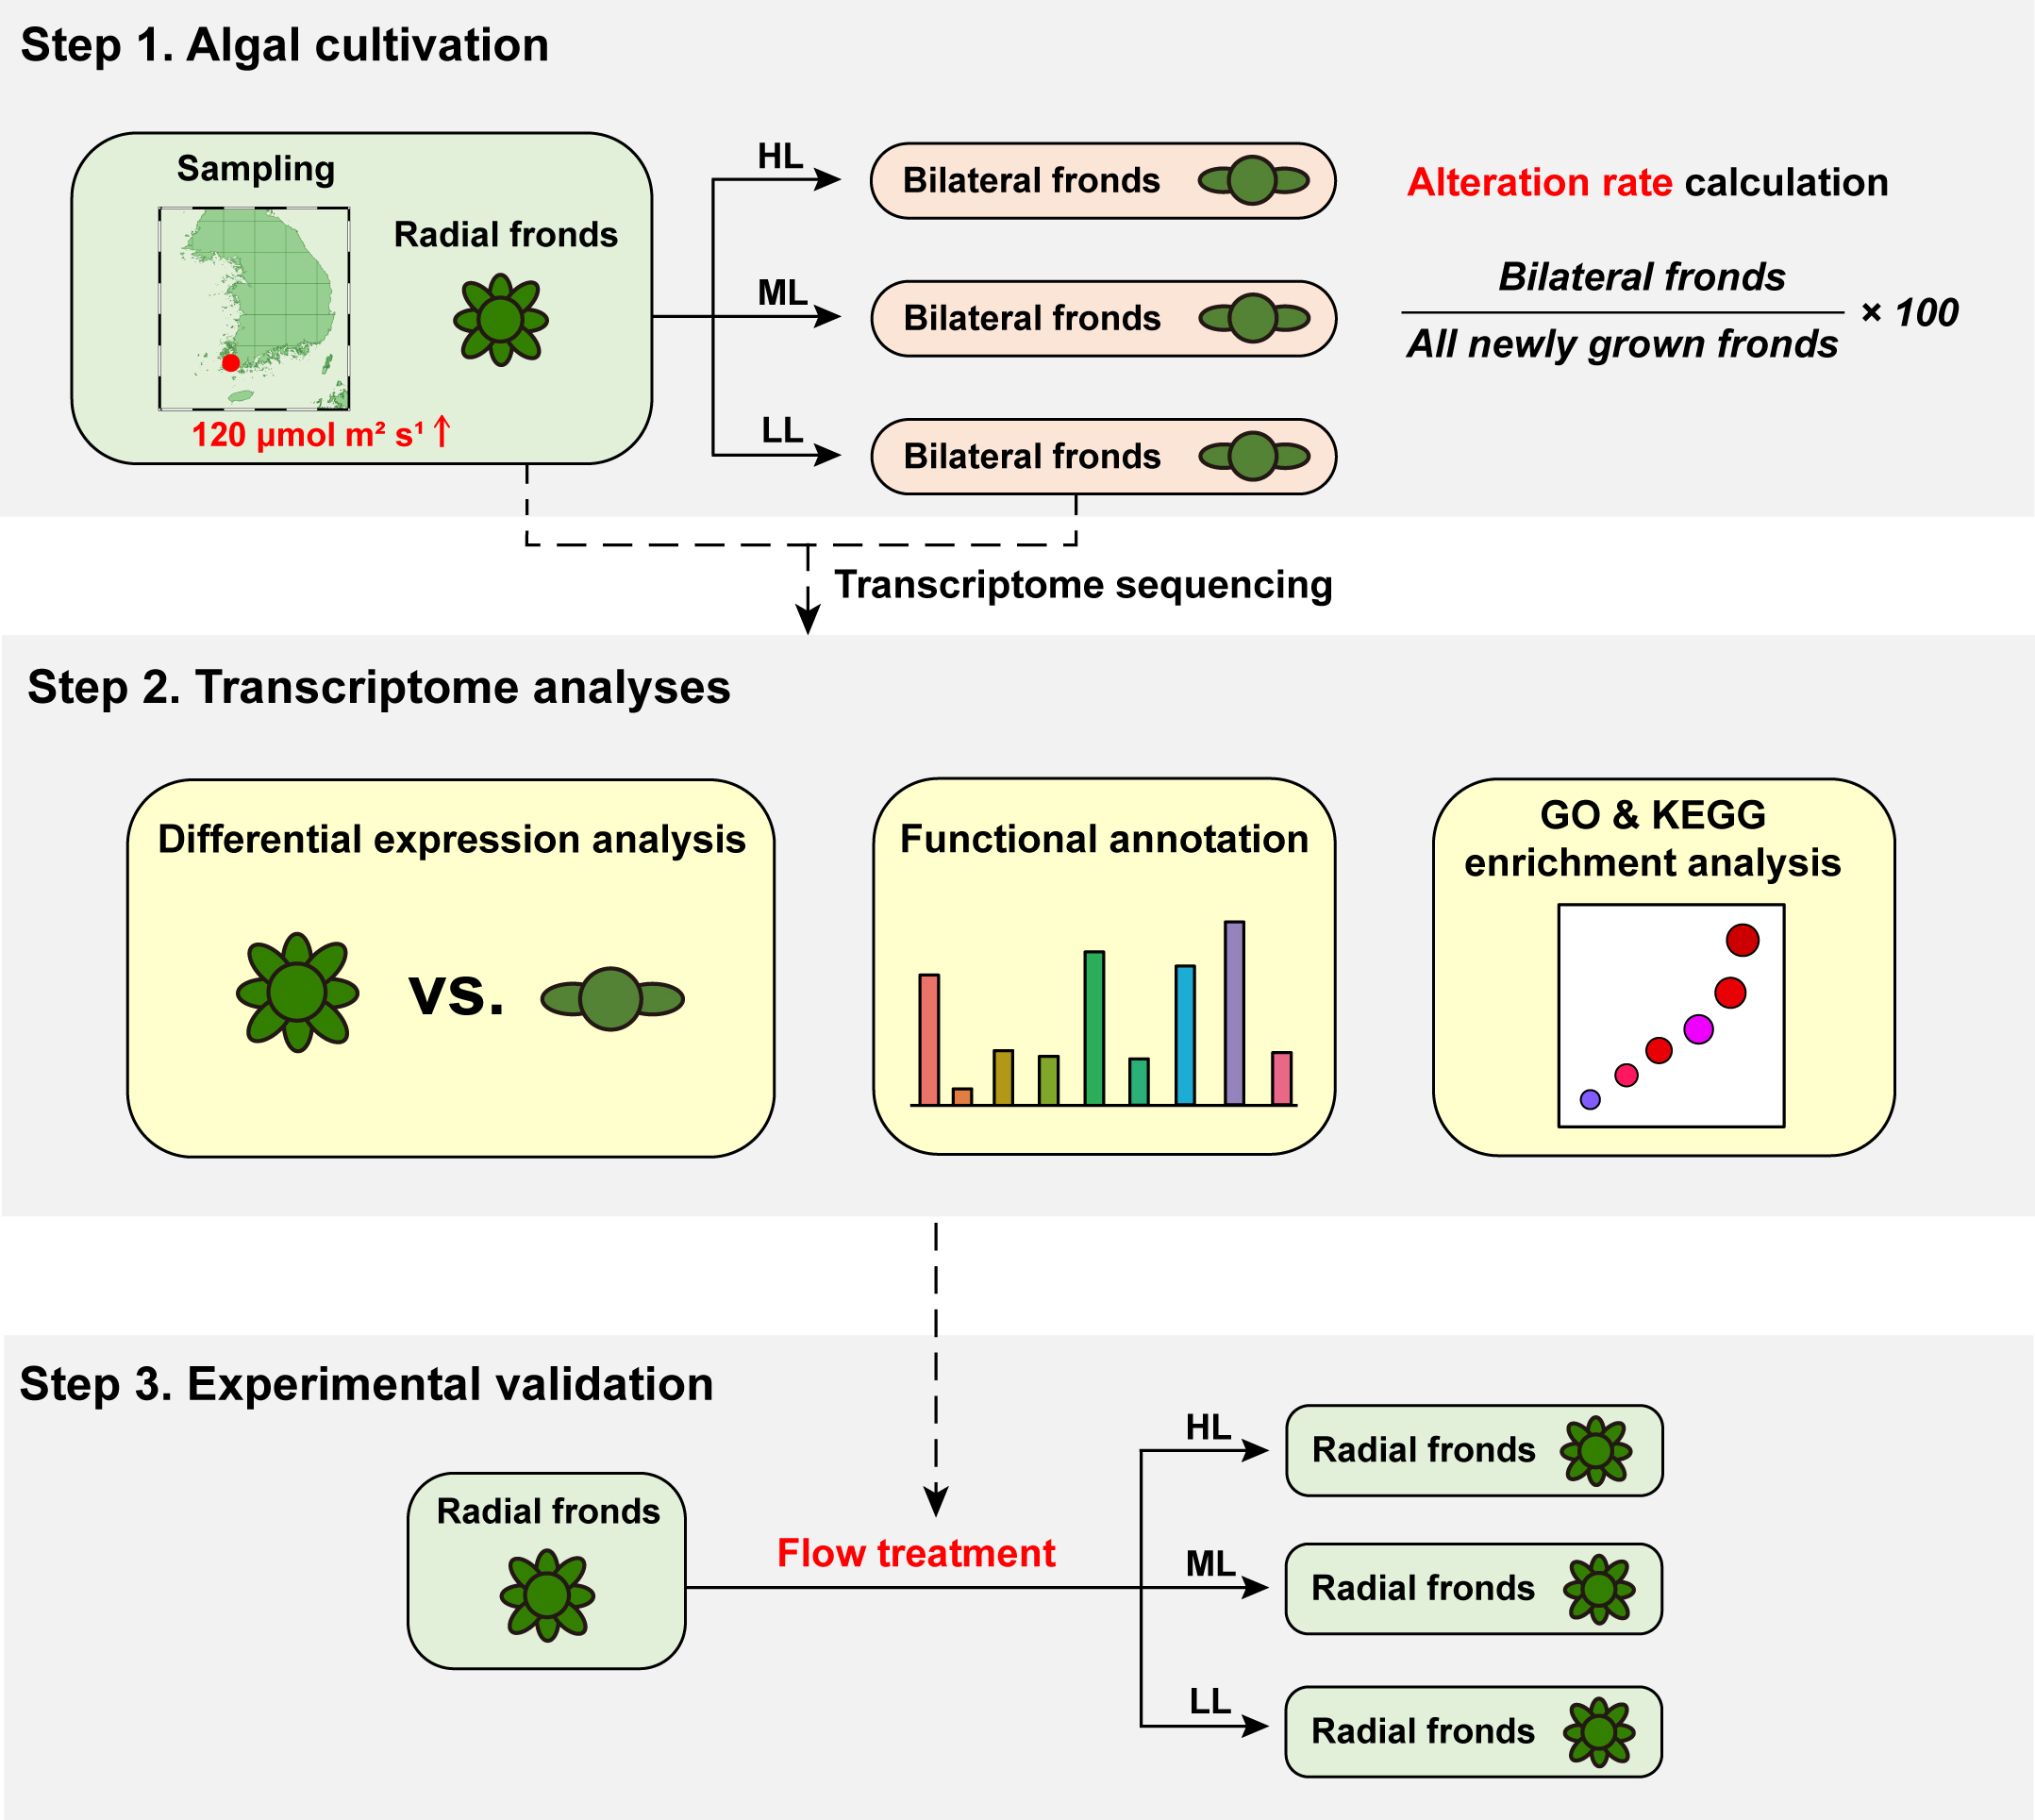
Figure 1. Overview of the experimental design and analysis conducted in our study. In step 1, we collected Caulerpa okamurae samples (radial fronds) from habitats with light intensity above 120 μmol m−2 s−1 and cultured them under three different light intensities to observe the plastic response of fronds (low-light: LL, 30 μmol m−2 s−1; middle light: ML, 60 μmol m−2 s−1; high light: HL, 120 μmol m−2 s−1). Then we performed whole transcriptome sequencing of radial and bilateral fronds. In step 2, the whole transcriptome data from each sample was employed for differential expression analysis, functional annotation, and GO & KEGG enrichment analysis. By integrating the previous reports and our transcriptome analysis results, we cultivated C. okamurae with flow treatment to control the phenotypic plasticity in step 3.
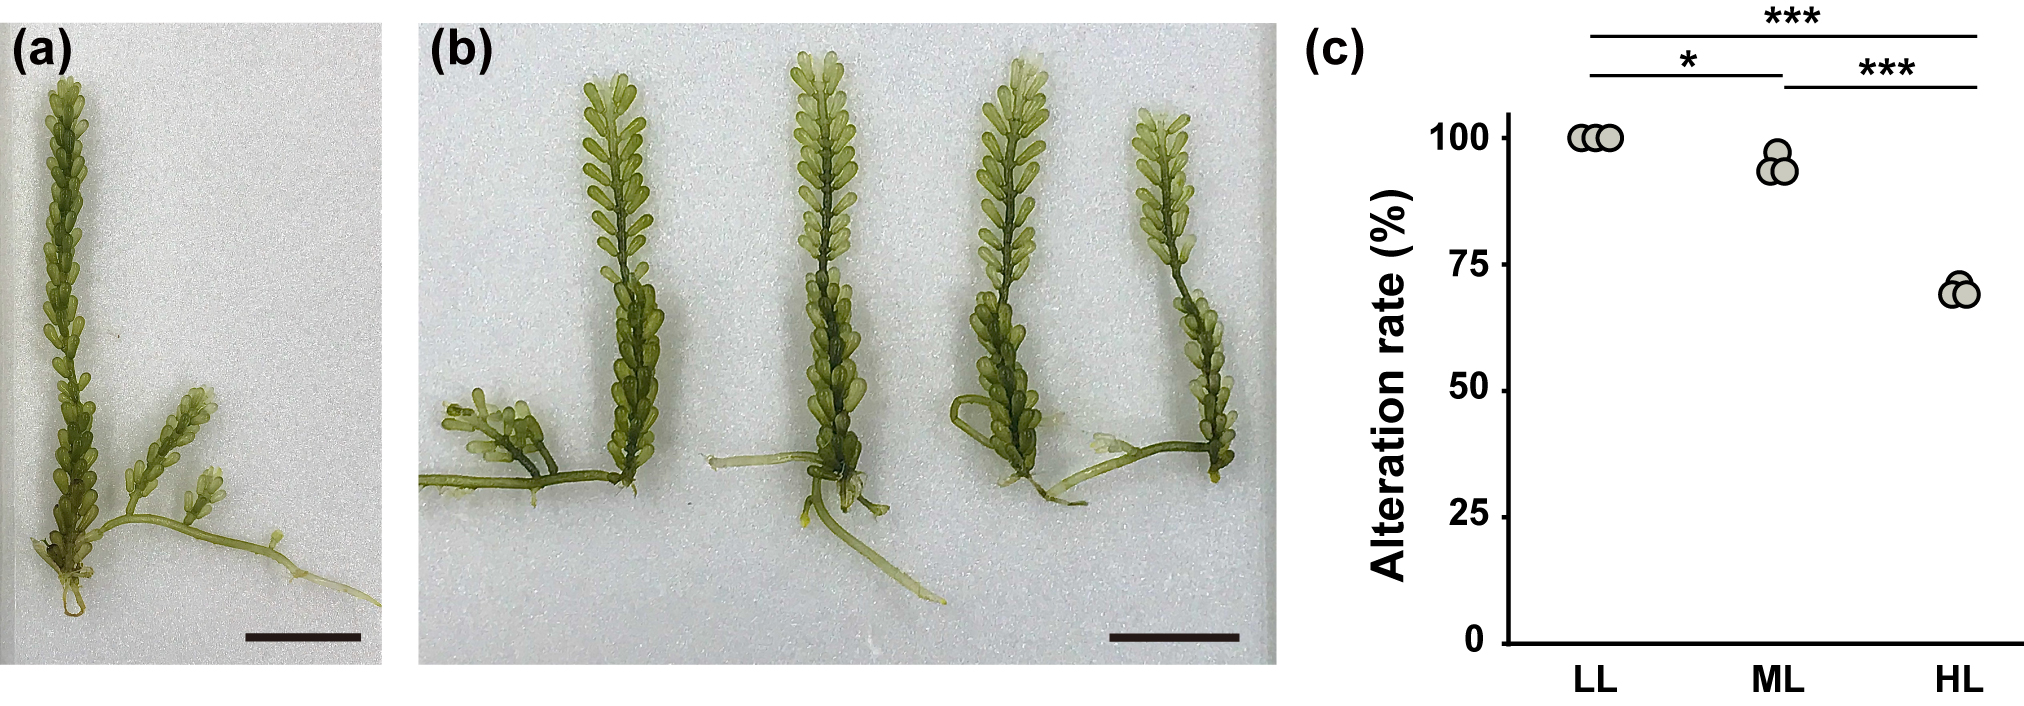
Figure 2. Caulerpa okamurae’s phenotypic plasticity under different light intensities. (a) Natural habitat phenotype (scale bars = 2cm). (b) Altered phenotype ten days after growth under low light intensity (30 μmol m−2 s−1) (scale bars = 2cm). (c) Phenotypically altered frond percentages in cultivars. The x-axis indicates light intensity (LL, 30 μmol m−2 s−1; ML, 60 μmol m−2 s−1; HL, 120 μmol m−2 s−1). The y-axis represents the alteration rates for the three light intensities, indicating bilaterally organized frond proportions among all newly grown fronds during the cultivation. Dots correspond to the alteration rates of three replicate groups for each light intensity. The number of newly grown fronds are as follows: LL (20, 22, and 20), ML (36, 35, and 39), and HL (38, 40, and 34). Asterisks indicate significant differences (*, p < 0.05; ***, p < 0.001) determined by one-way ANOVA followed by Tukey’s HSD (honestly significant difference) comparisons.
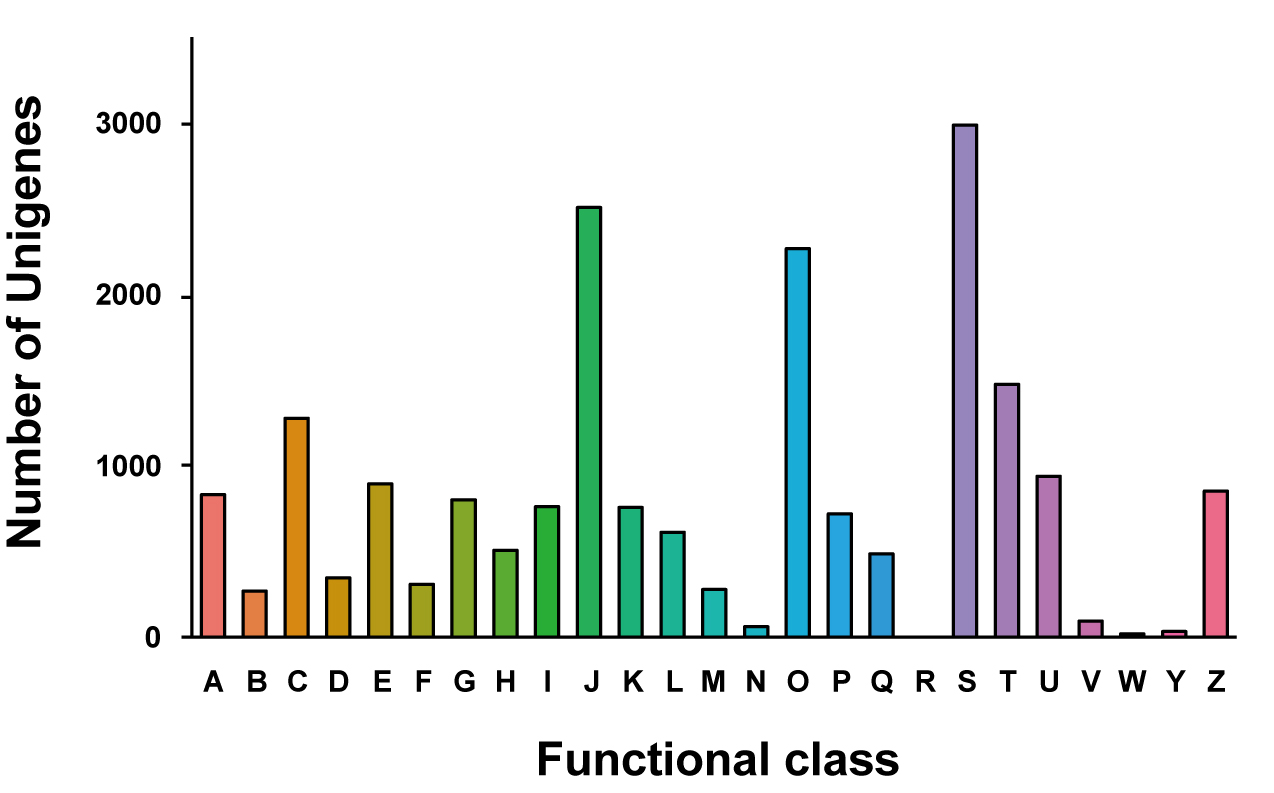
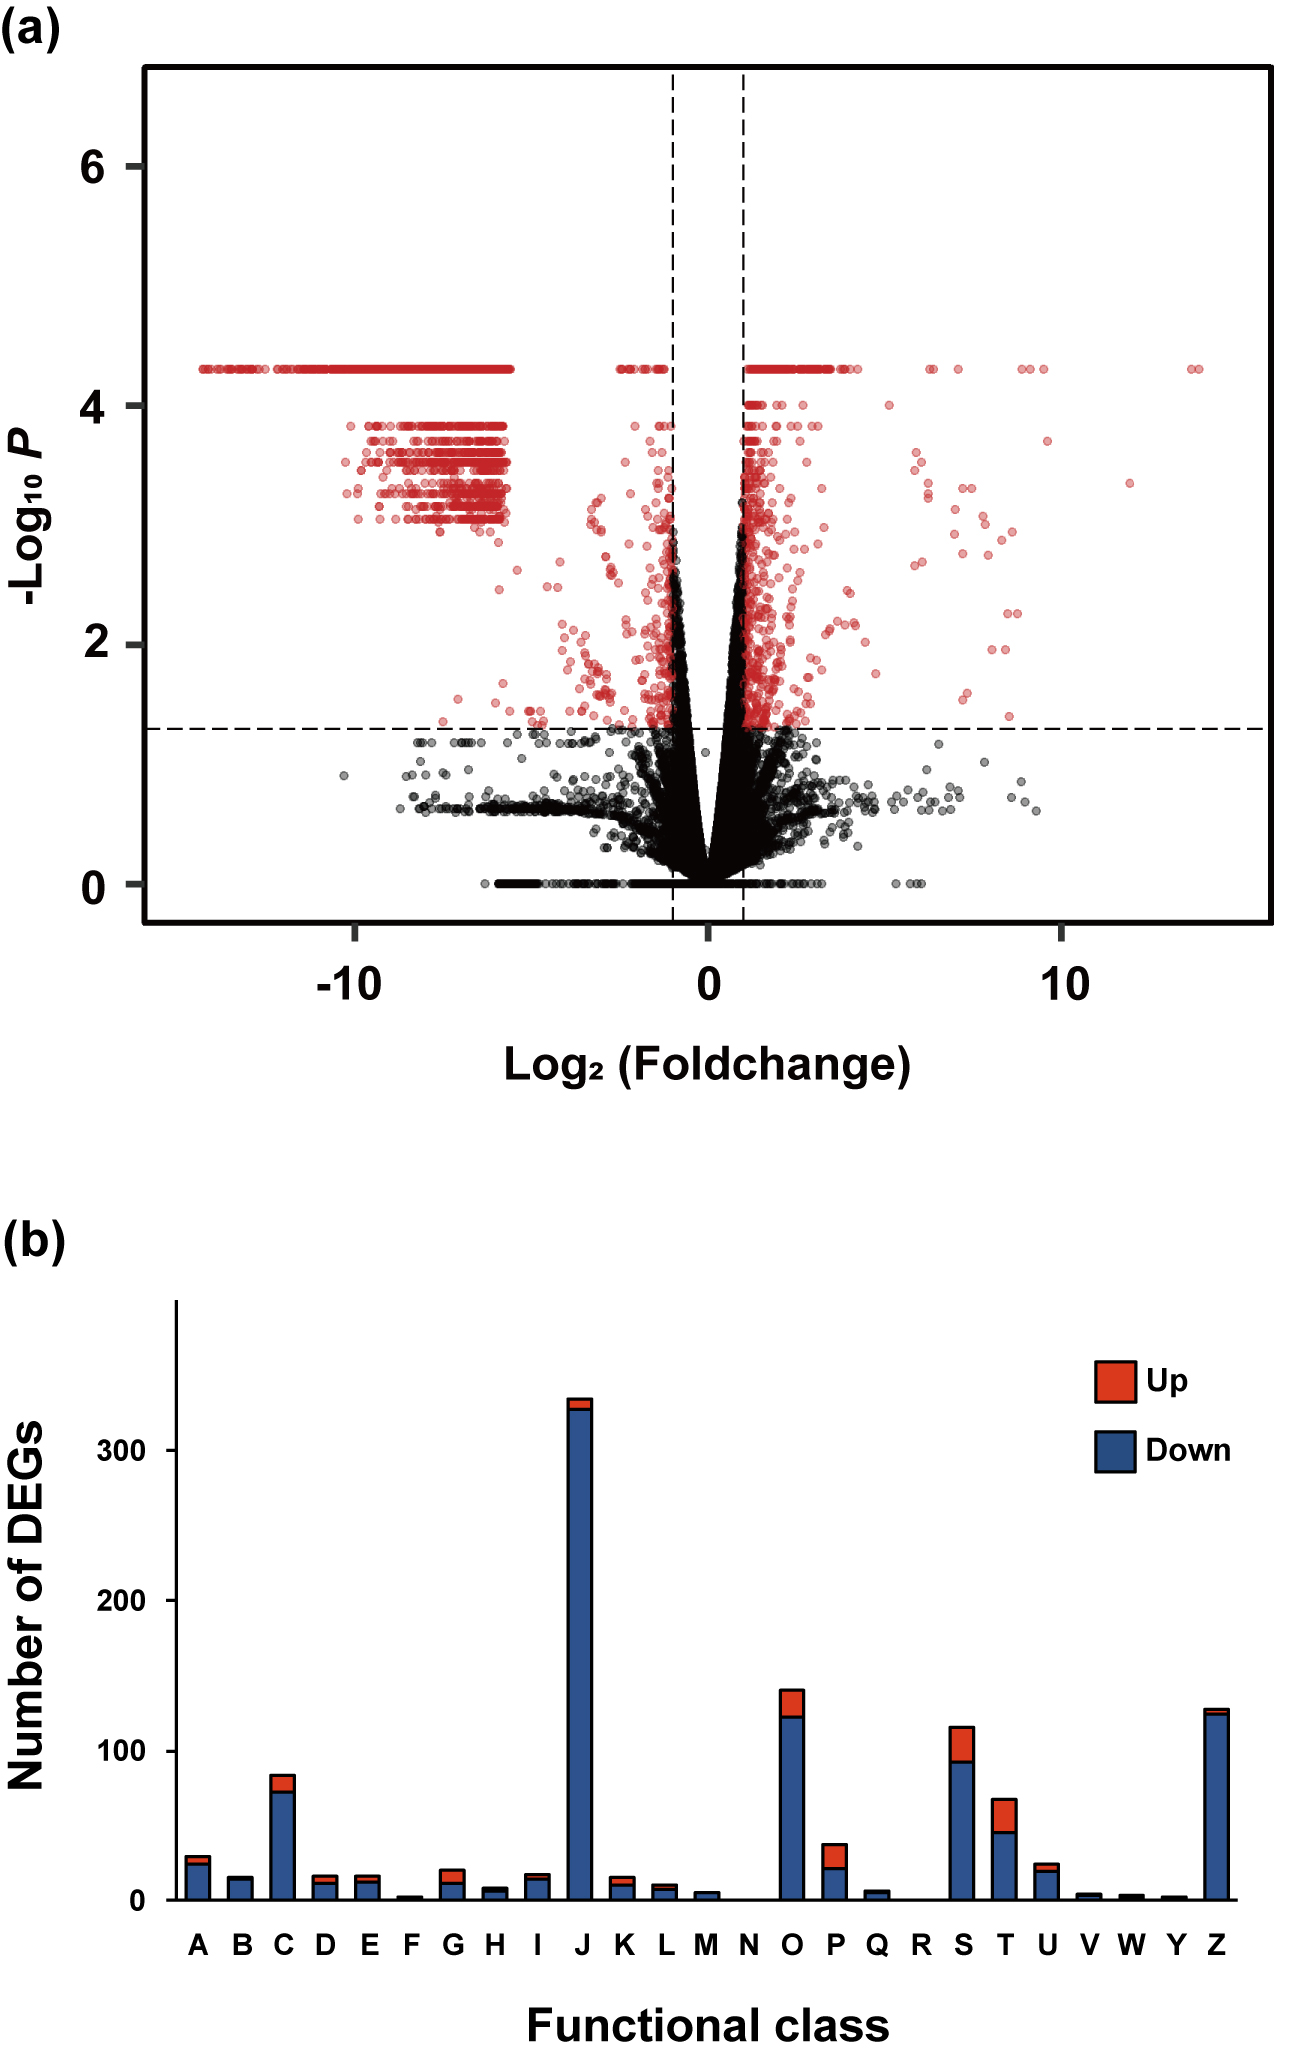
Figure 3. Differentially expressed genes (DEGs) analysis comparing bilateral and radial phenotype C. okamurae frond samples. (a) Volcano map illustrating unigene expression levels and statistical significance. The x-axis represents the log2 (fold-change) for expression level in bilateral compared to radial samples. The y-axis represents the −log10 (p-value), indicating the statistical significance of the expression level between bilateral and radial frond samples. The p-values ranged from 5e-5 to 1. A standard of |log2 (fold-change)| ≥ 1 and a p-value of < 0.05 was set as the unigene threshold for significantly differential expression. DEGs are indicated by red dots. (b) DEGs classifications based on the euKaryotic Orthologous Groups of proteins (KOG) database. The x-axis represents the functional classes from KOG, including (A) RNA processing and modification; (B) chromatin structure and dynamics; (C) energy production and conversion; (D) cell cycle control and mitosis; (E) amino acid metabolism and transport; (F) nucleotide metabolism and transport; (G) carbohydrate metabolism and transport; (H) coenzyme metabolism; (I) lipid metabolism; (J) translation; (K) transcription; (L) replication, recombination, and repair; (M) cell wall/membrane/envelope biogenesis; (N) cell motility; (O) posttranslational modification, protein turnover, chaperones; (P) inorganic ion transport and metabolism; (Q) secondary metabolite biosynthesis, transport, and catabolism; (R) general function prediction only; (S) function unknown; (T) signal transduction; (U) intracellular trafficking and secretion; (V) defense mechanisms; (W) extracellular structures; (Y) nuclear structure; and (Z) cytoskeleton. The y-axis represents the categorized genes in each class. Upregulated and downregulated genes are indicated by red and blue bars, respectively.
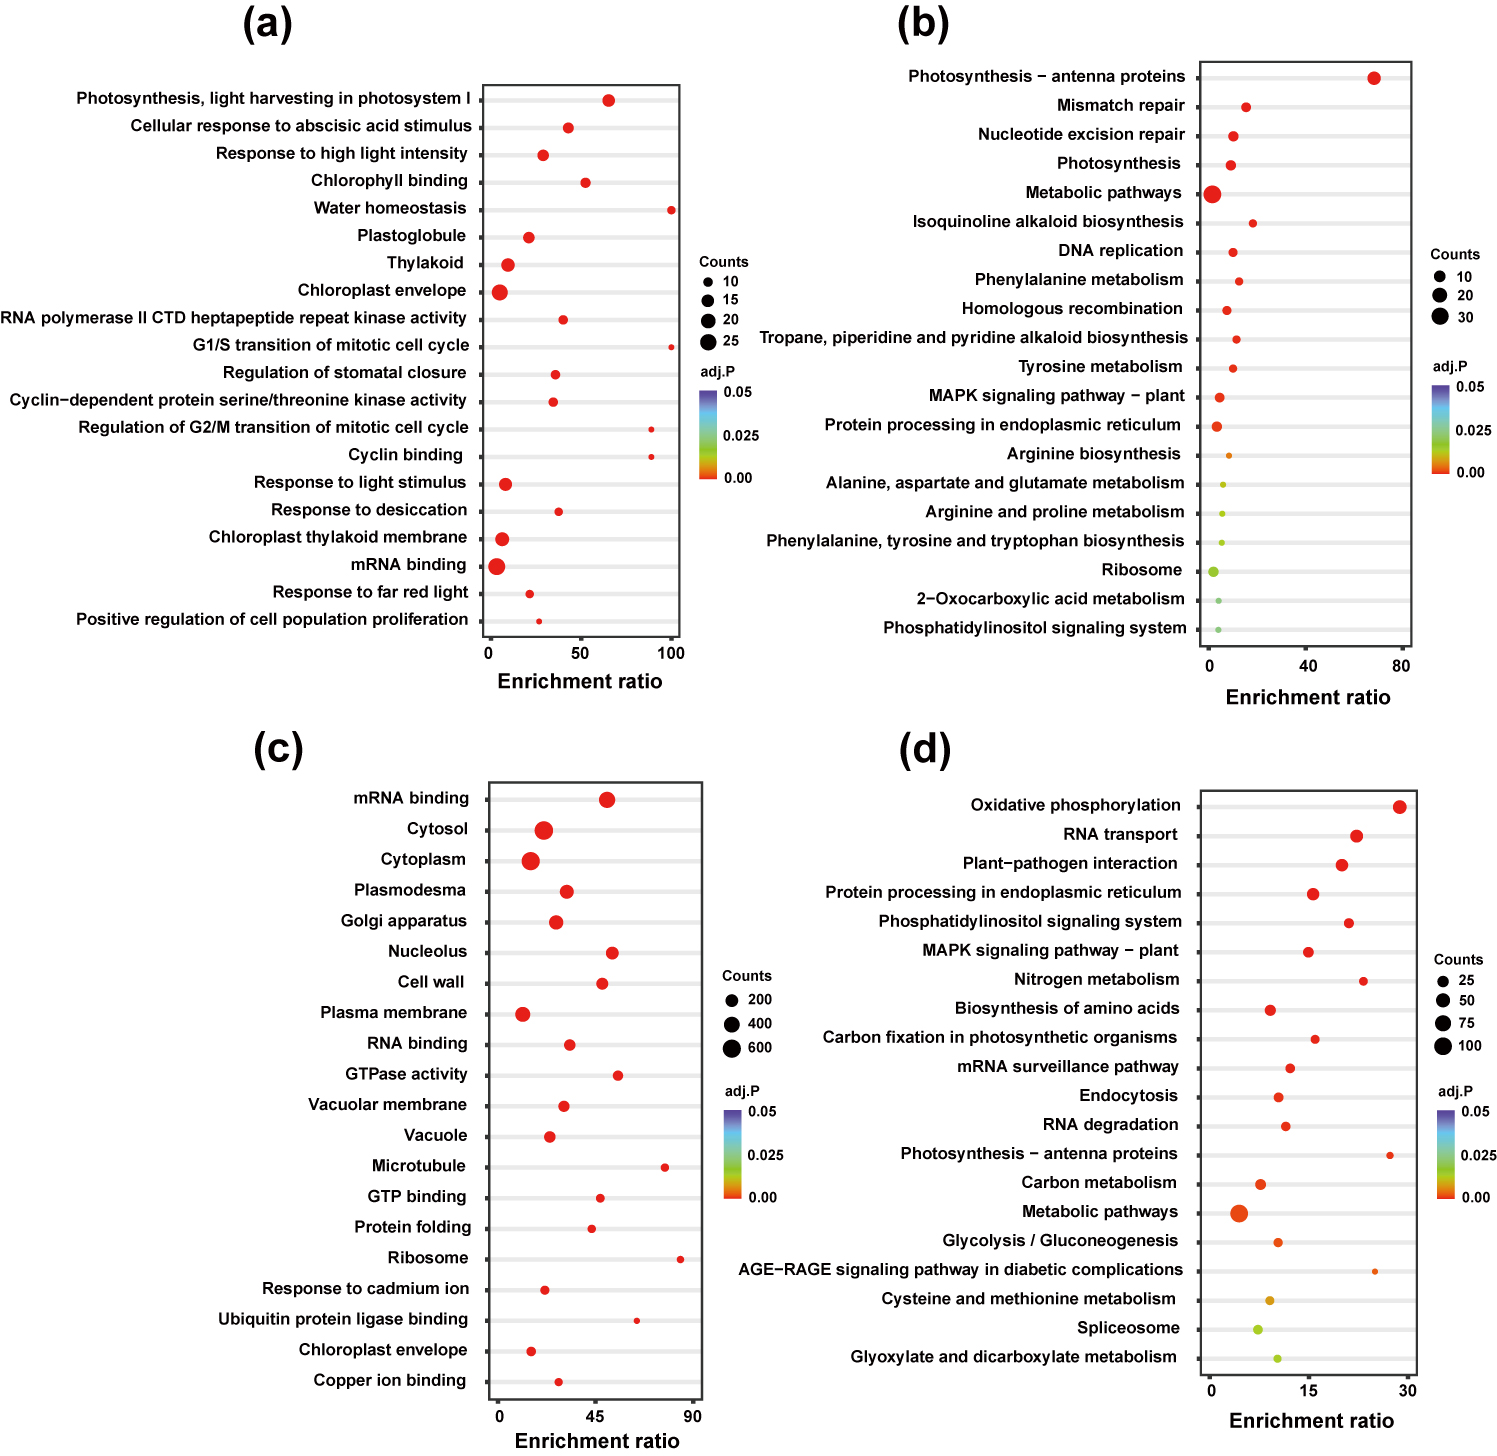
Figure 4. Functional enrichment analysis of differentially expressed genes (DEGs) comparing bilateral to radial frond samples based on the Gene Ontology (GO) and Kyoto Encyclopedia of Genes and Genomes (KEGG) databases. Dot size indicates the number of significant genes. Significantly enriched (a) GO terms and (b) KEGG pathways for upregulated genes and significantly enriched (c) GO terms and (d) KEGG pathways for downregulated genes. The top 20 terms and pathways are represented, while the remaining are listed in Supporting File 2. The x-axis represents the enrichment ratio, calculated by significant genes / total genes × 100. The y-axis represents the GO terms and KEGG pathways, sorted based on their significance as determined using Benjamini-Hochberg adjusted p-values and represented by dot colors.
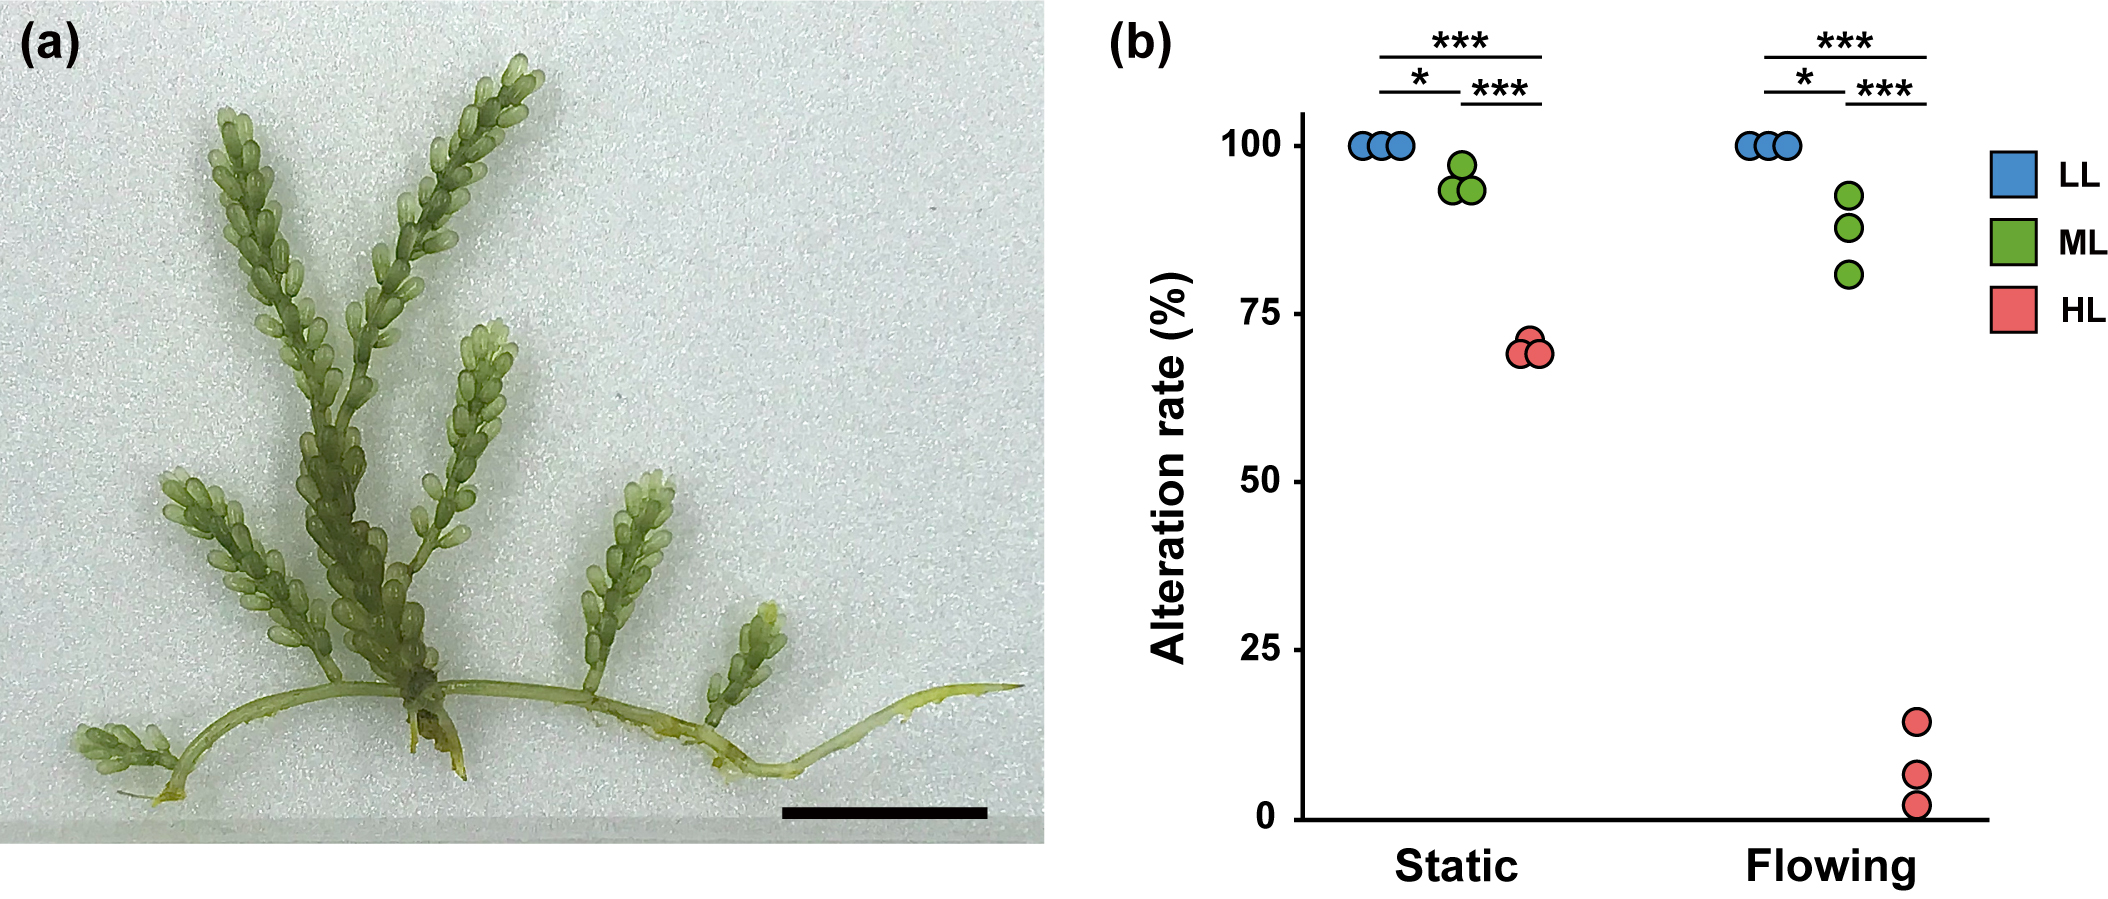
Figure 5. Caulerpa okamurae’s phenotypic plasticity in response to water flow and light intensity. (a) Caulerpa okamurae’s phenotype after ten days of growth under high light intensity (120 μmol m−2 s−1) with a water flow treatment (scale bar = 2 cm). (b) Phenotypically altered frond percentages in C. okamurae grown under three light intensity treatments and hydrodynamic conditions. The x-axis indicates the hydrodynamic conditions, including static and flow treatments. The y-axis represents the alteration rate, indicating bilaterally organized frond proportions among all newly grown fronds during the experiment. Dots correspond to the alteration rates of three replicate groups for each treatment. Dot colors denote samples grown under low light (blue; 30 μmol m−2 s−1), middle light (green; 60 μmol m−2 s−1), and high light (red; 120 μmol m−2 s−1). The numbers of newly grown fronds are as follows: LL×static (20, 22, and 20), ML×static (36, 35, and 39), HL×static (38, 40, and 34), LL×flow (39, 48, and 36), ML×flow (47, 54, and 41), and HL×flow (77, 62, and 53). Asterisks indicate significant differences (*, p < 0.05; ***, p < 0.001) determined by one-way ANOVA followed by Tukey’s HSD (honestly significant difference) comparisons.
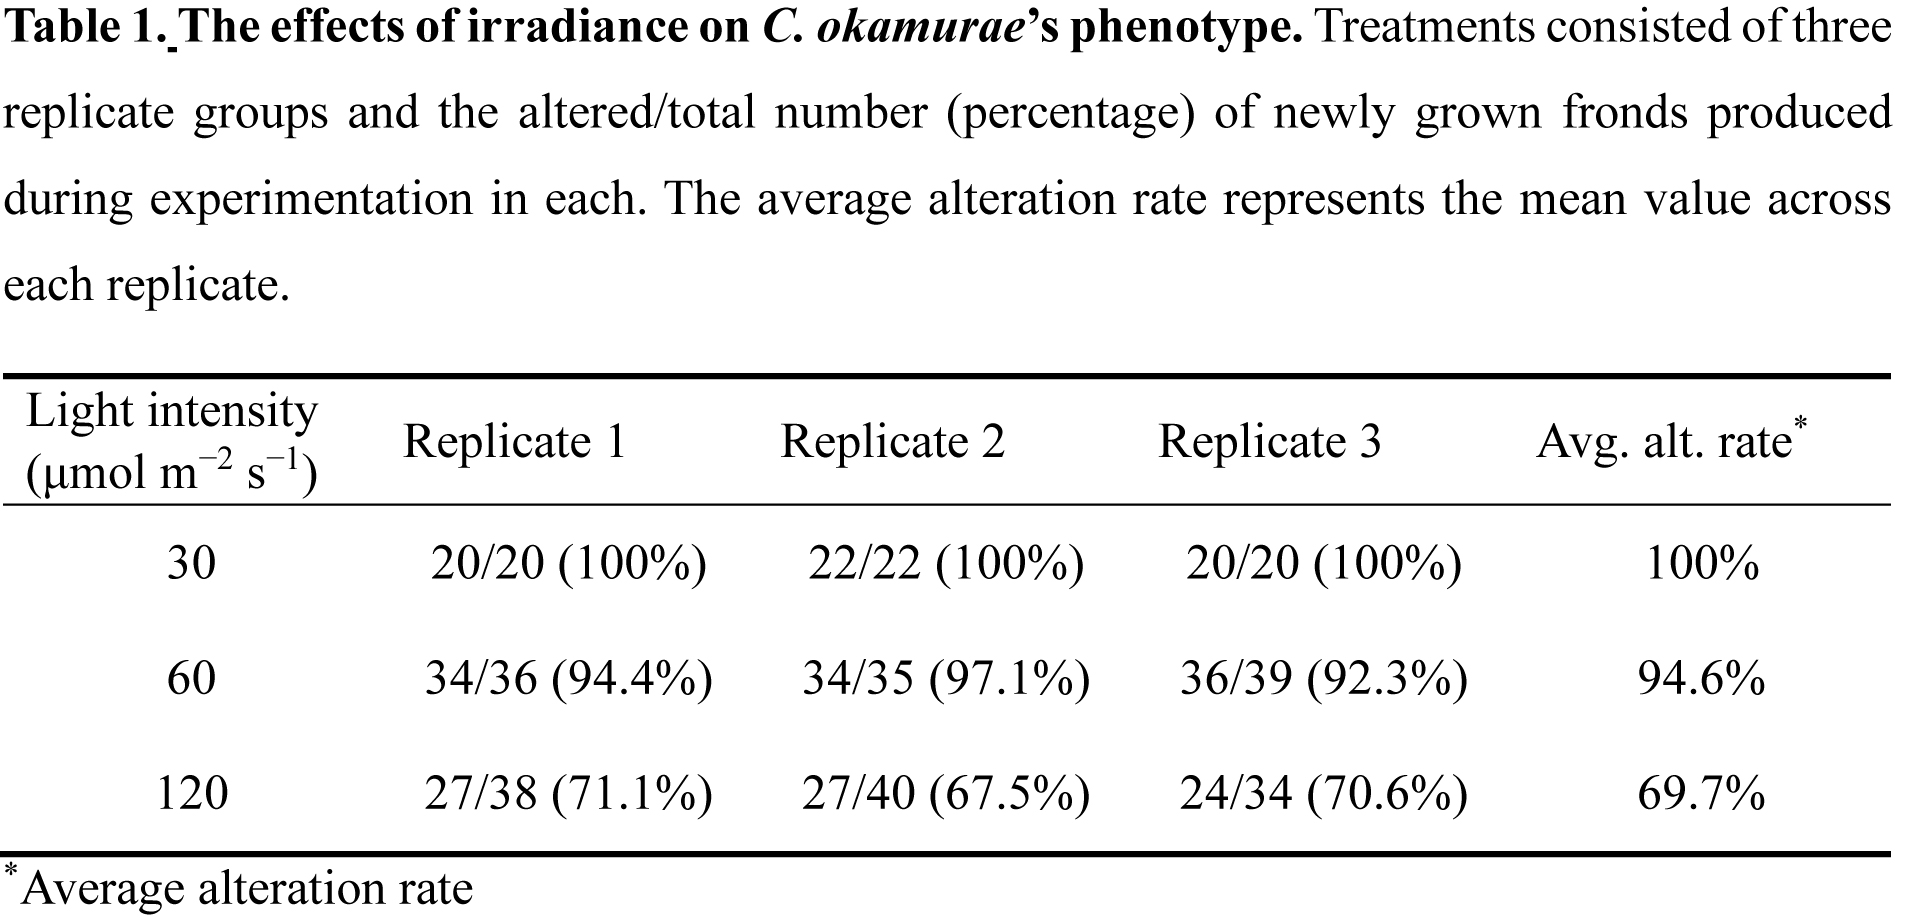
Table 1. The effects of irradiance on C. okamurae’s phenotype. Treatments consisted of three replicate groups and the altered/total number (percentage) of newly grown fronds produced during experimentation in each. The average alteration rate represents the mean value across each replicate.
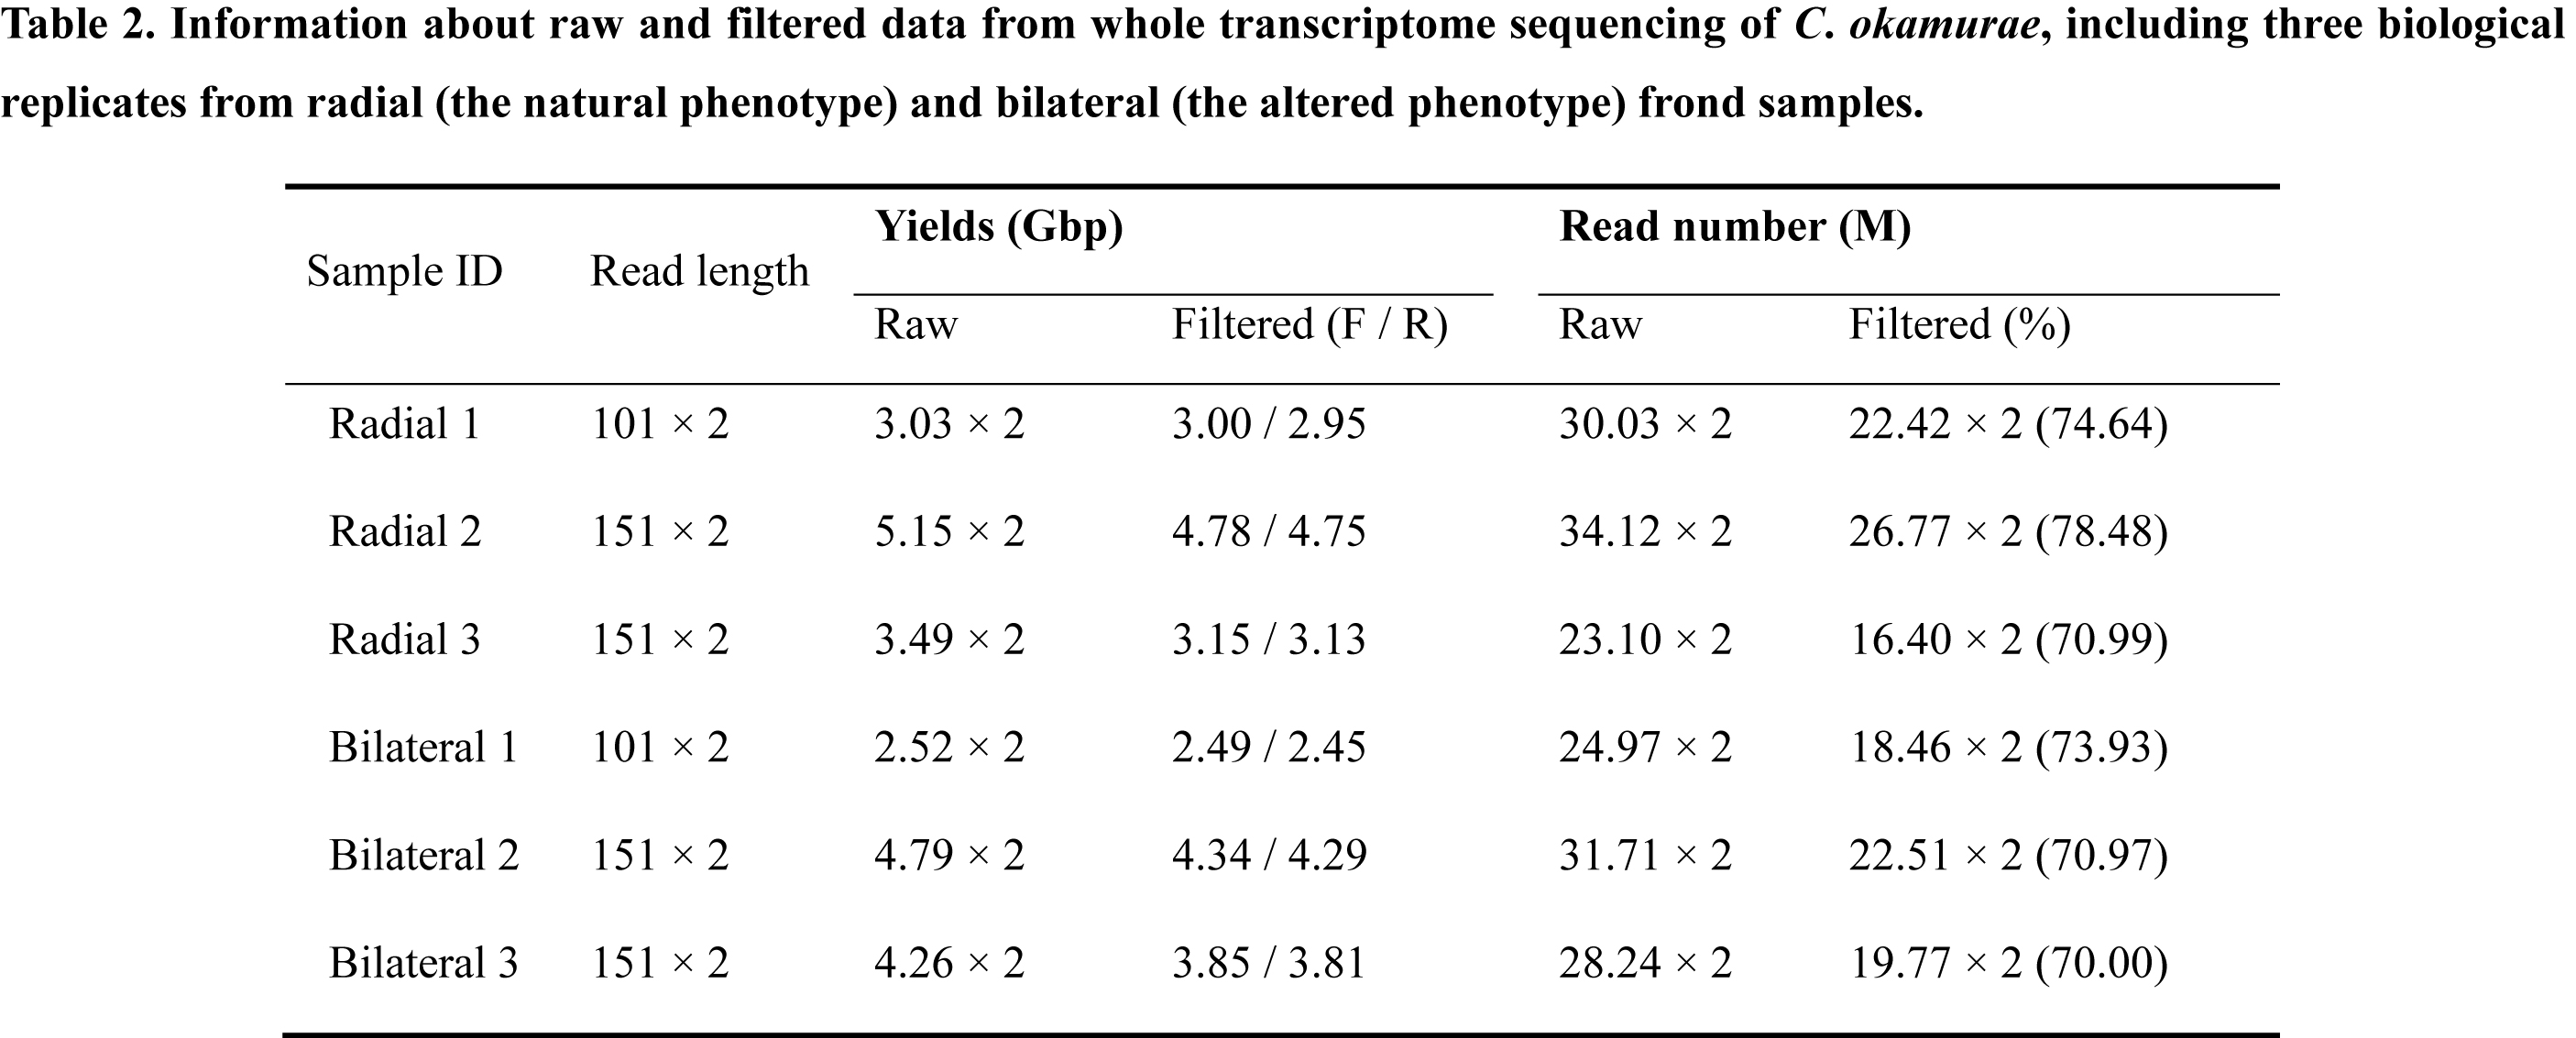
Table 2. Information about raw and filtered data from whole transcriptome sequenceing of C. okamurae, including three biological replicates from radial (the natural phenotype) and bilateral (the altered phenotype) frond samples.
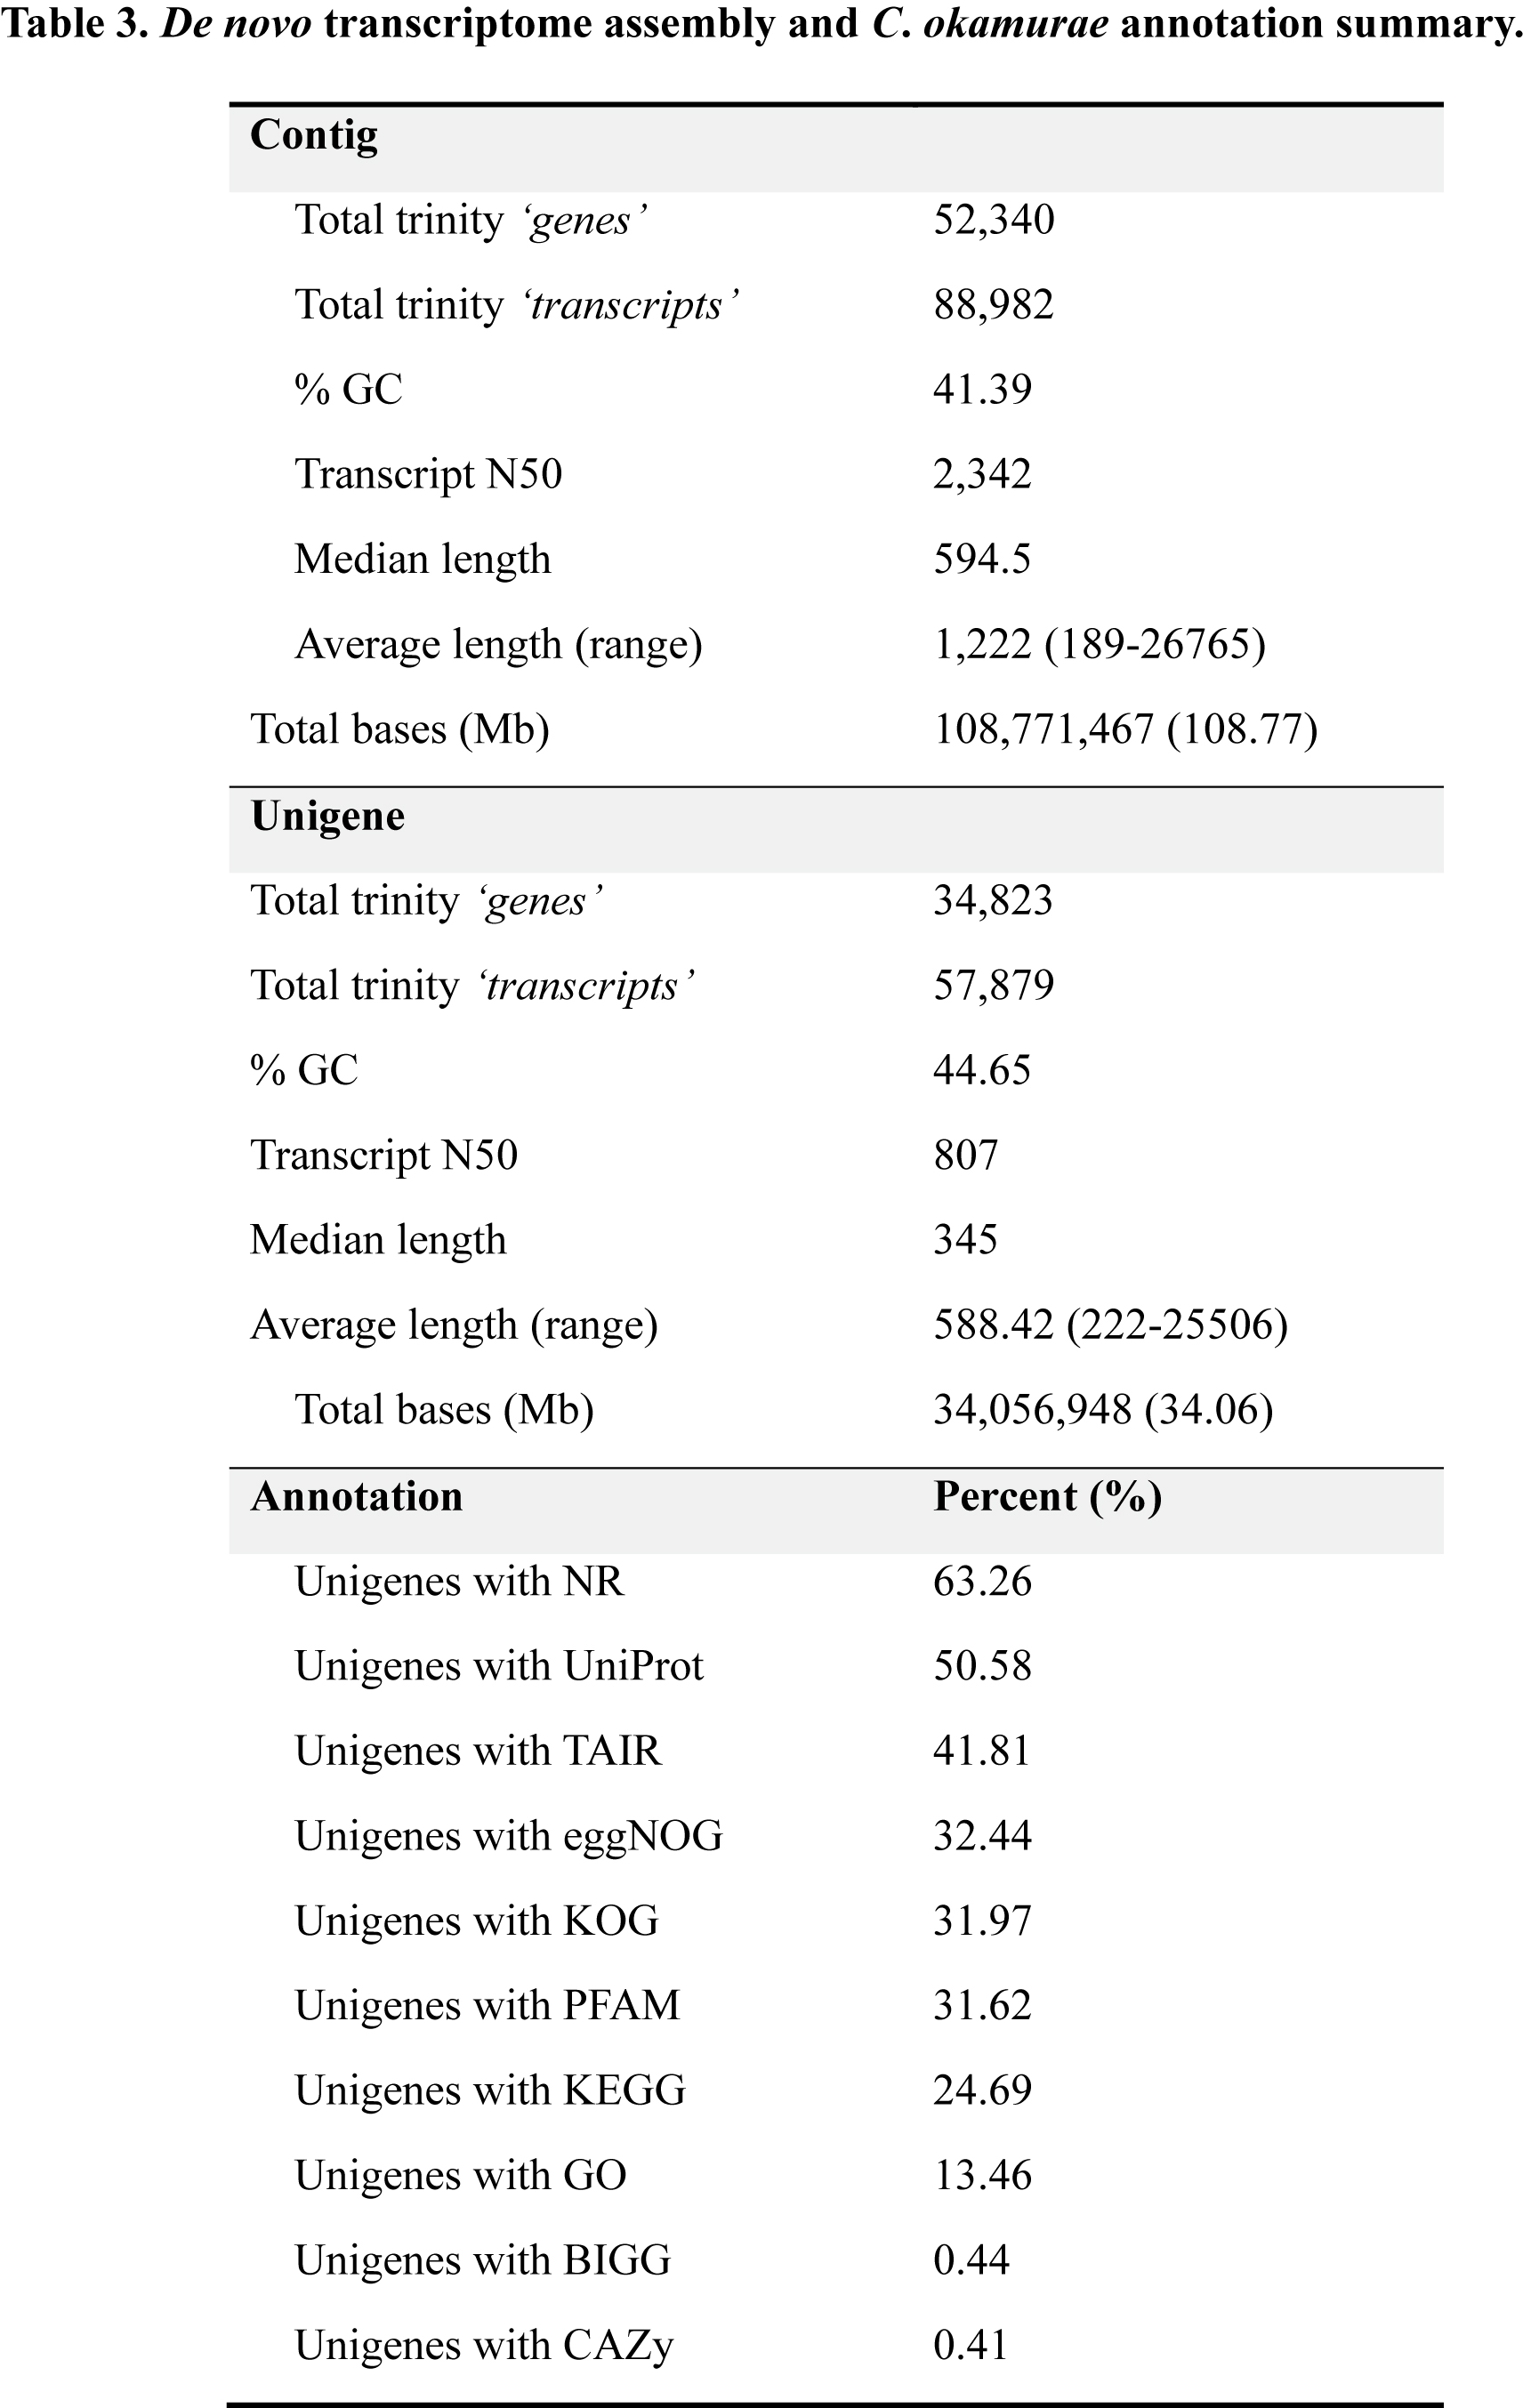
Table 3. De novo transcriptome assembly and C. okamurae annotation summary.
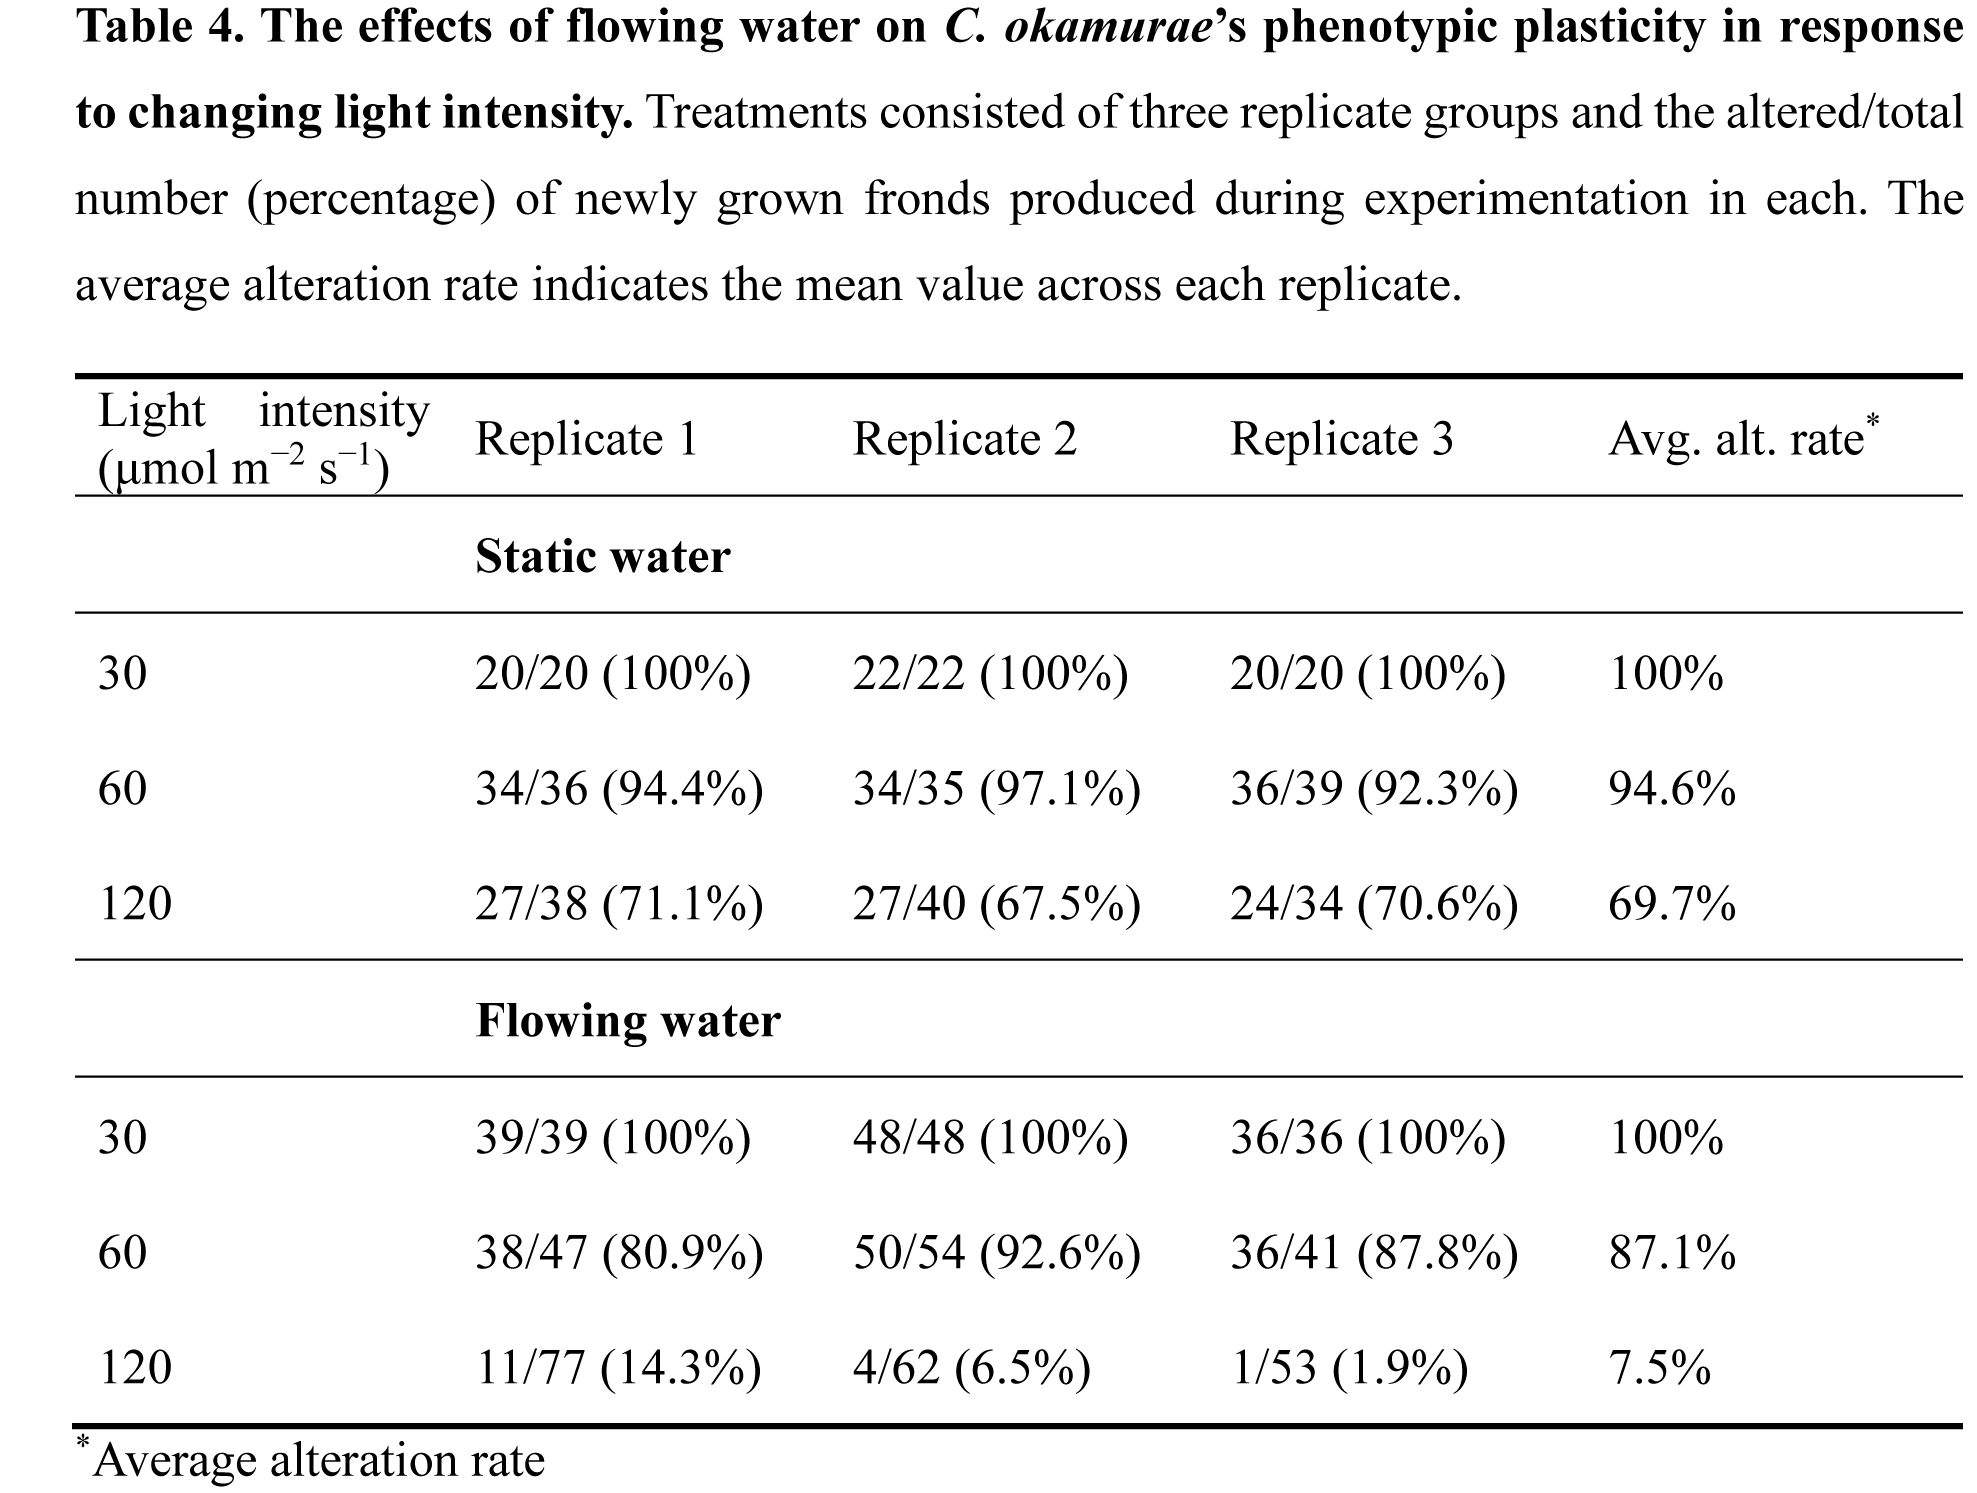
Table 4. The effects of flowing water on C. okamurae's phenotypic plasticity in response to changing light intensity. Treatments consisted of three replicate groups and the altered/total number (percentage) of newly grown fronds produced during experimentation in each. The average alteration rate indicates the mean value across each replicate.
— Supporting Information (Colored and High resolution) —
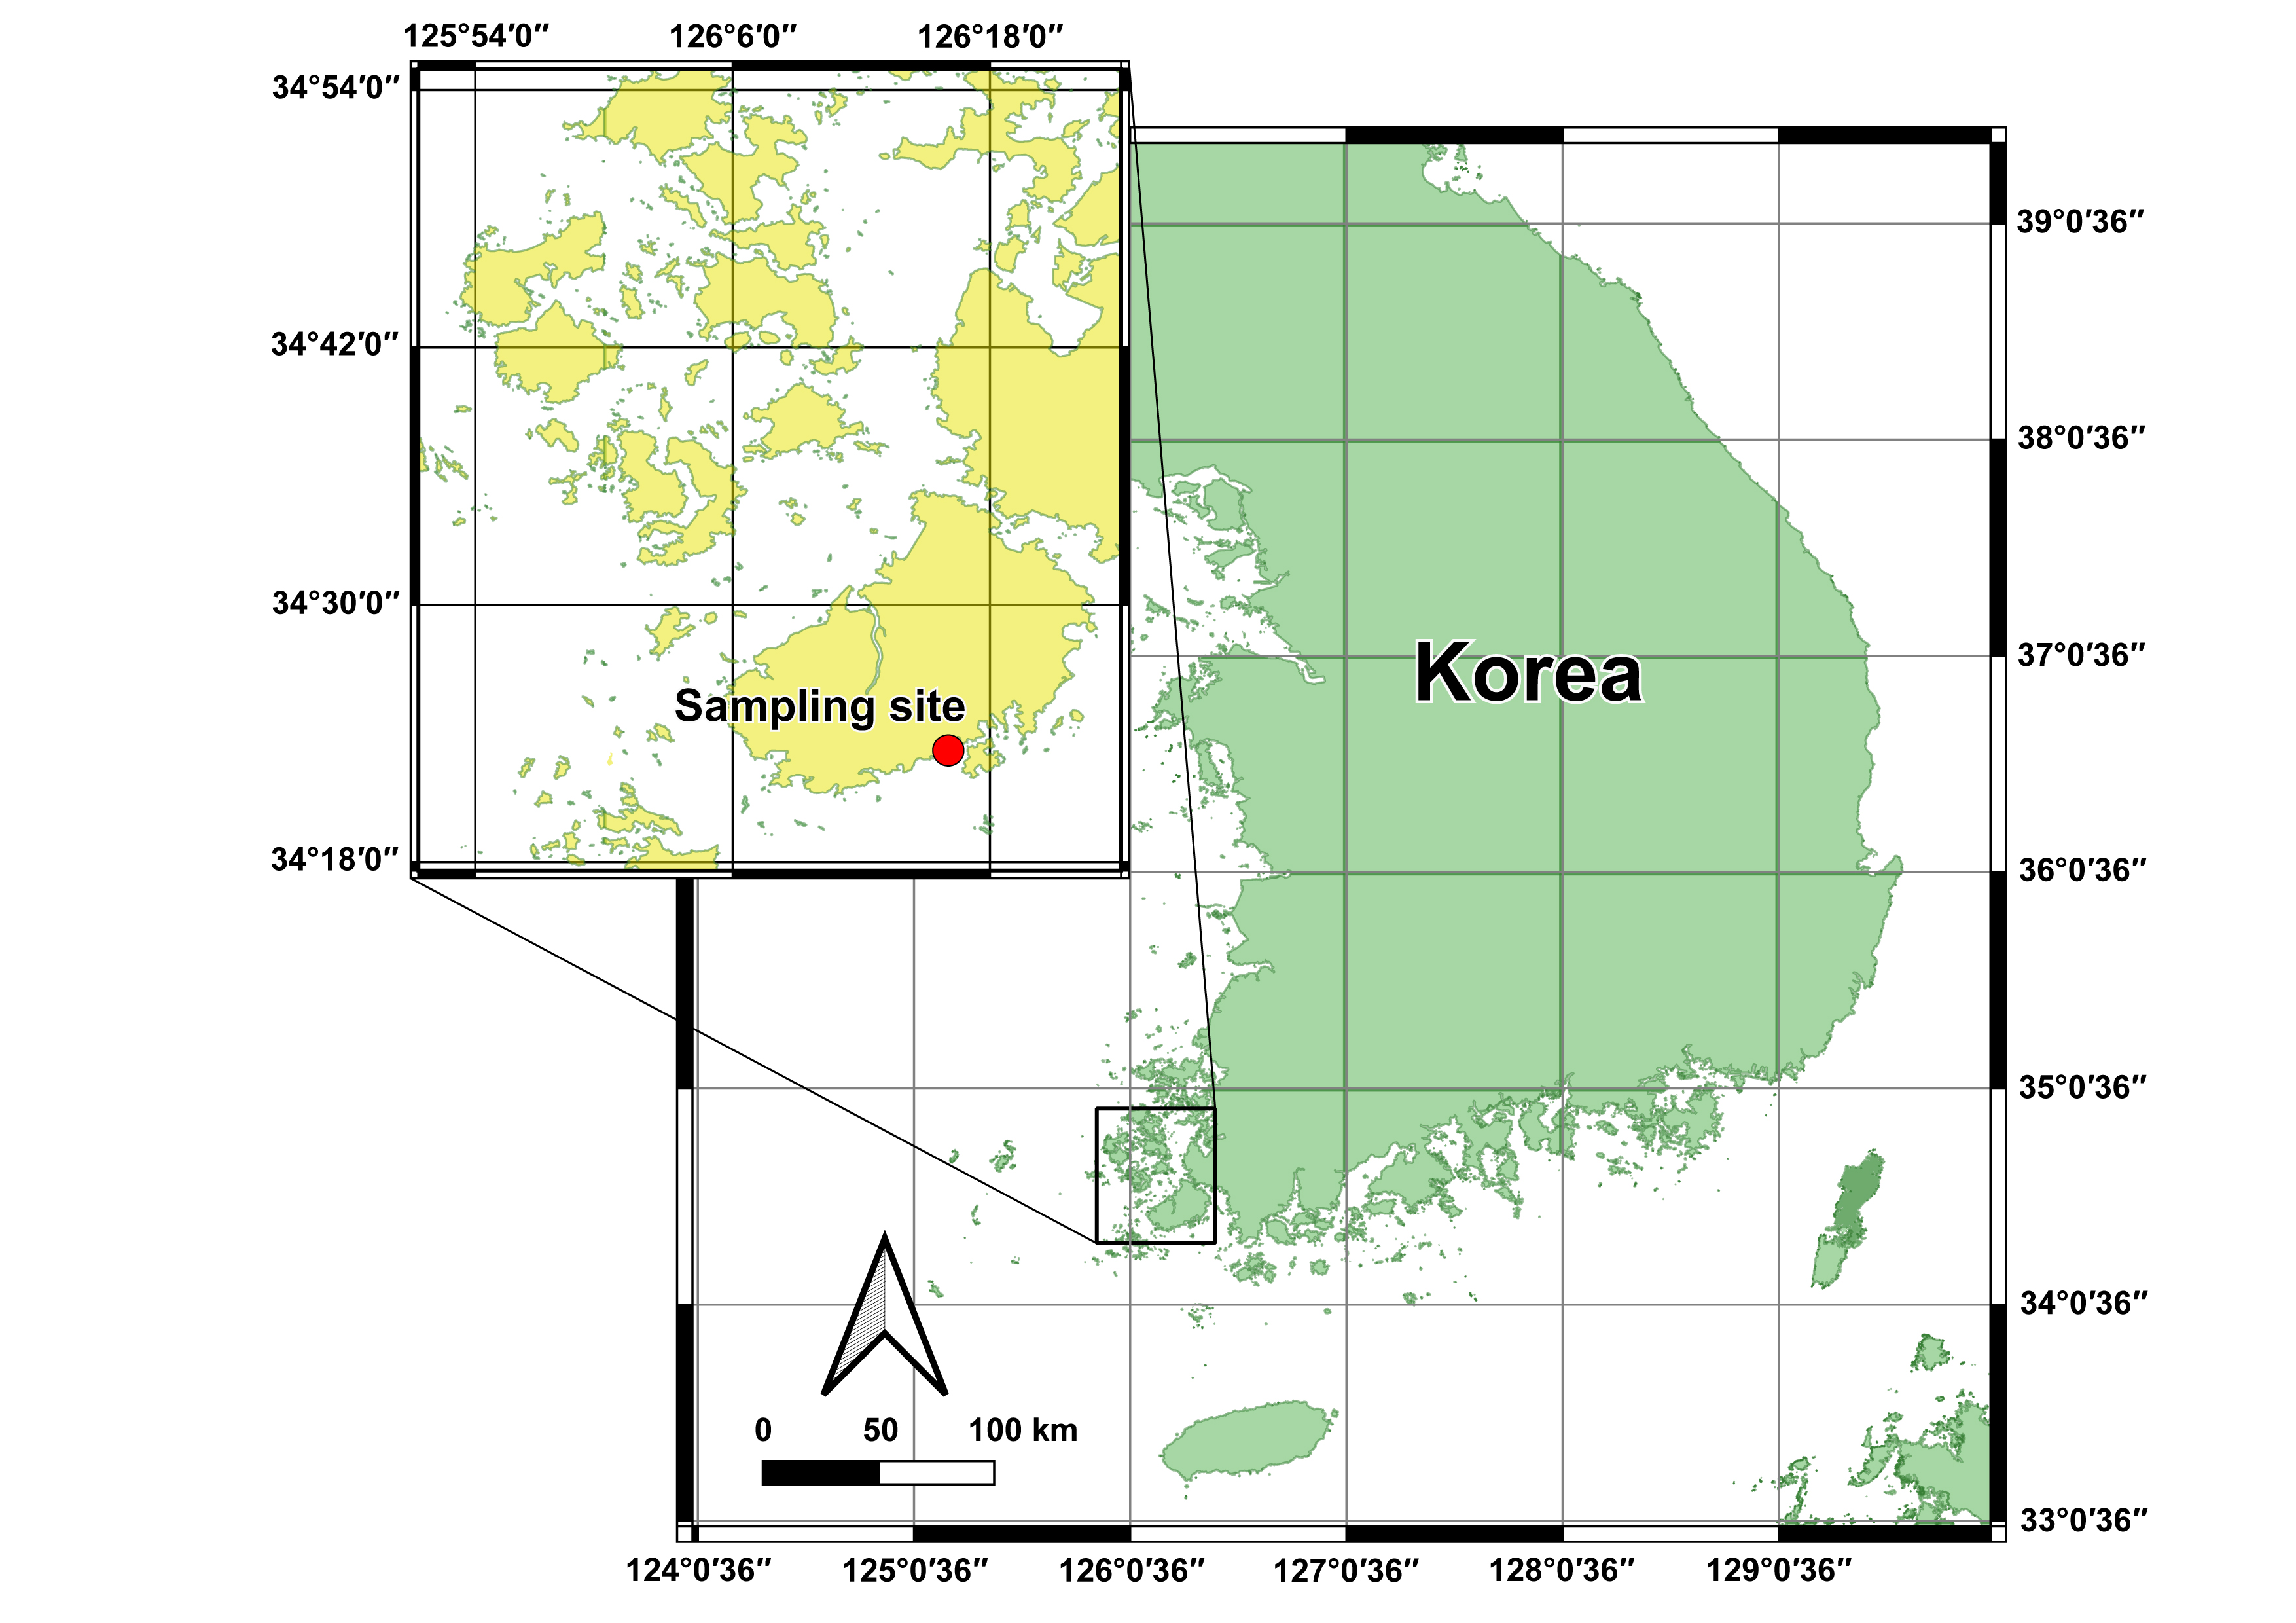
Figure S1. Location of the samling site (red dot) for C. okamurae in the lower intertidal zone along the coast of Jindo, Jeonnam, Korea. The base map is derived from OpenStreetMap and OpenStreetMap Foundation, under the Open Database License (https://www.openstreetmap.org/copyright). The map was visualized using QGIS (ver. 3.32.0; https://qgis.org/).
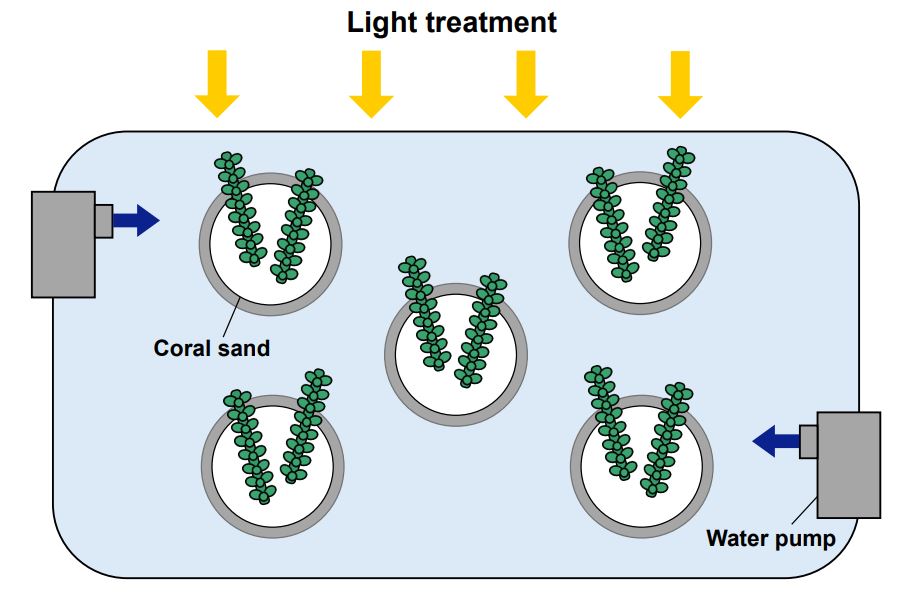
Figure S2. The setup of a cultivation container for observing the phenotypic plasticity of C. okamurae. Water flow was generated using two water pumps (3W, HJ-311, Mondialfauna, Italy) installed in a transparent acrylic tank.
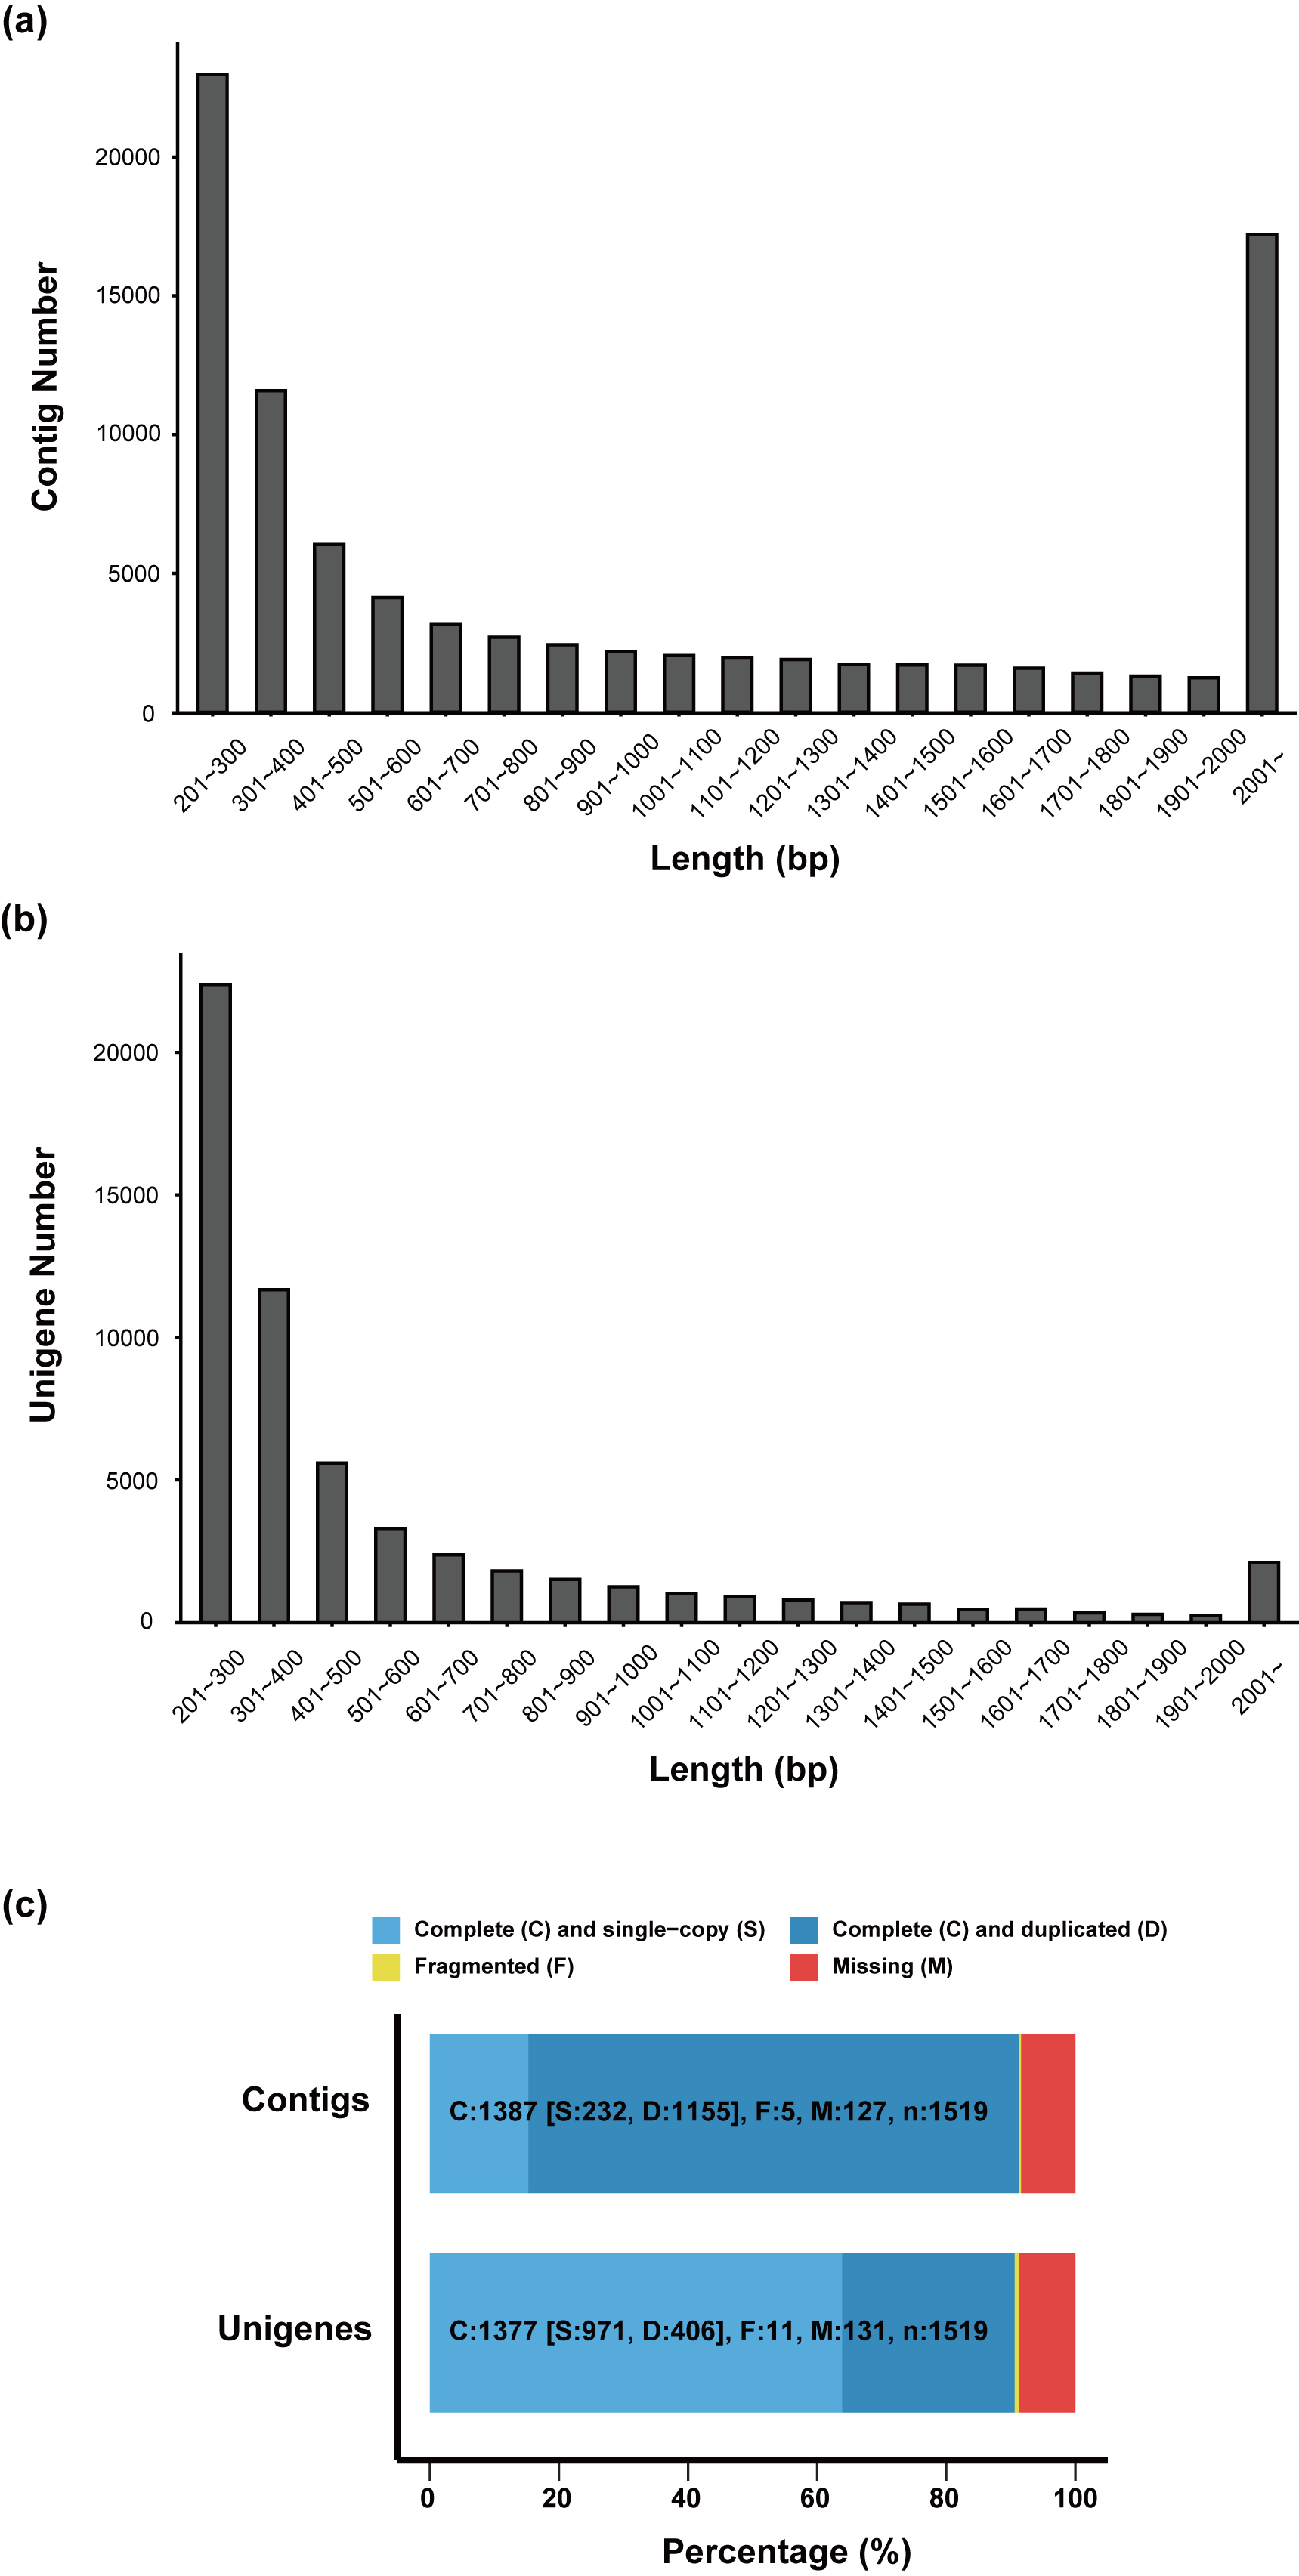
Figure S3. De novo transcriptome assemblies’ length distribution and completeness. (a) Initially assembled contig length distributions. (b) Length distributions of the non-redundant gene set (unigenes) derived from the contig. (c) Transcriptome assembly completeness assessment based on comparing contigs and unigenes. BUSCO reference orthologs were categorized into four groups using the BUSCO pipeline: complete and single-copy (blue), complete and duplicated (deep blue), fragmented (yellow), and missing (red).
Figure S4. Unigene classifications using the KOG database. Functional classes are described in Figure 3b.
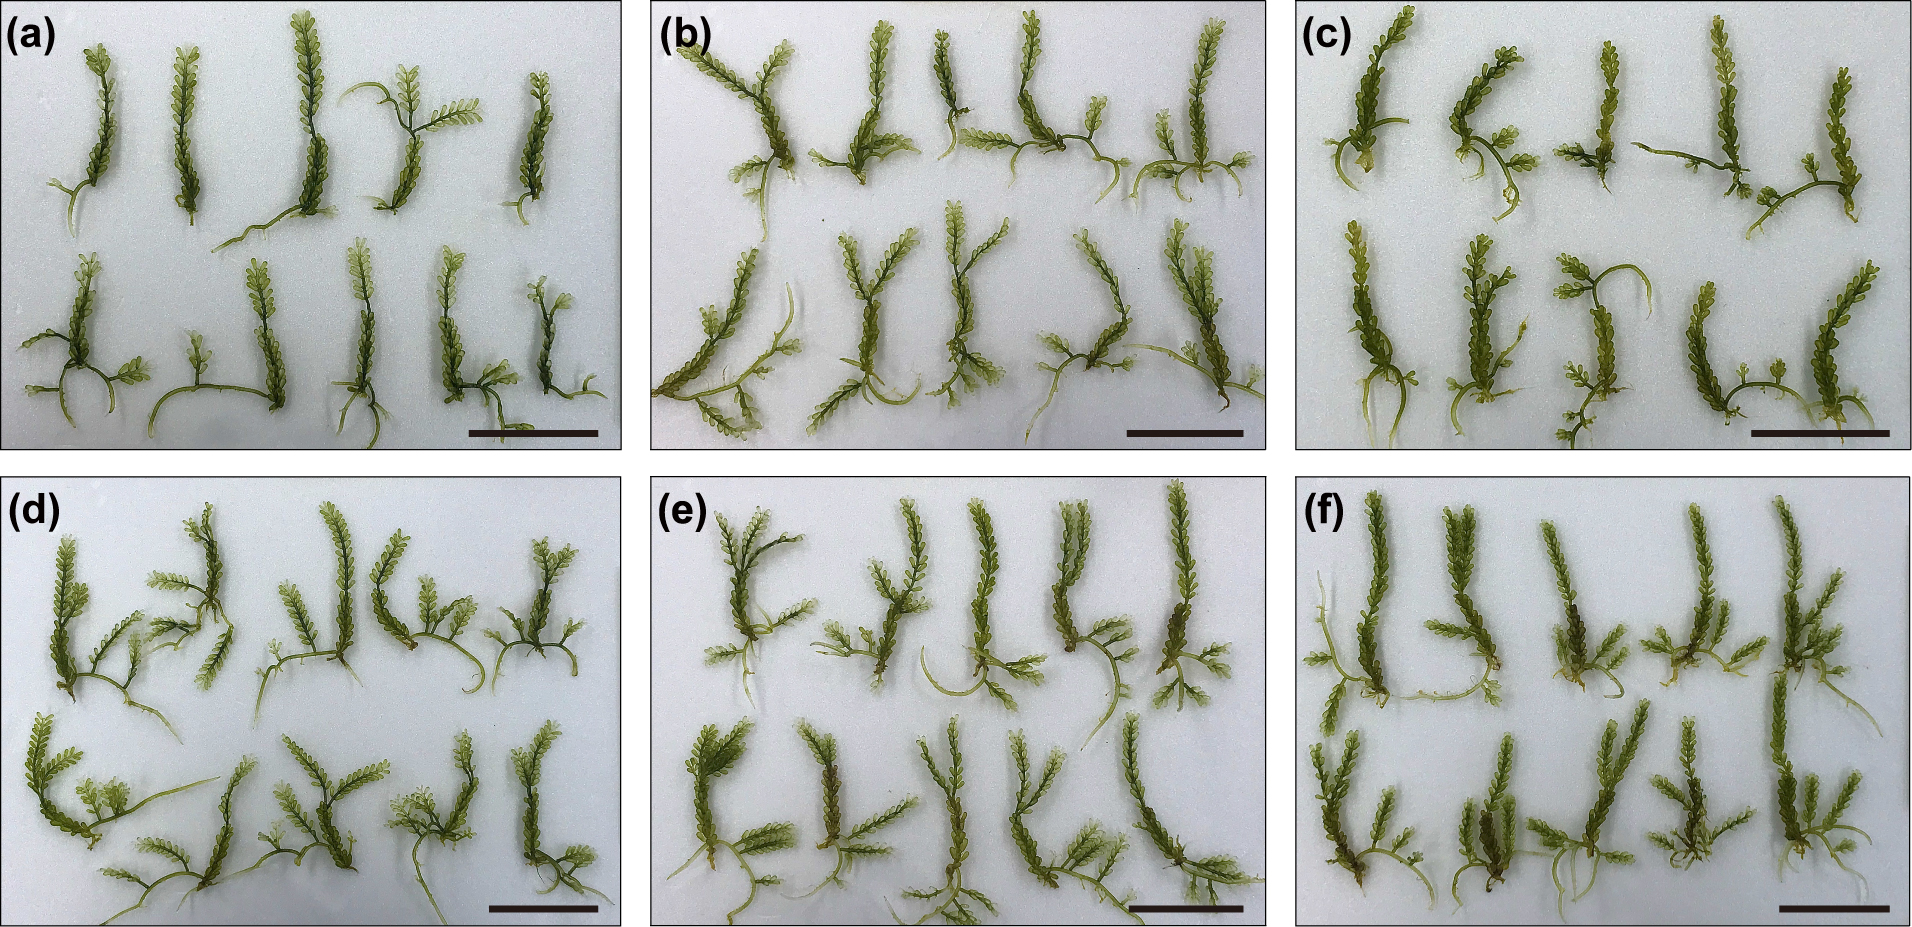
Figure S5. Comparison of phenotypes of C. okamurae cultivars regarding water flow (scale bars = 5cm). (a-c) Thalli grown in static water under three light intensities: low light (LL; 30 μmol m−2 s−1), middle light (ML; 60 μmol m−2 s−1), and high light (HL; 120 μmol m−2 s−1). (d-f) Thalli grown in flowing water under three light intensities: LL, ML, and HL, respectively.
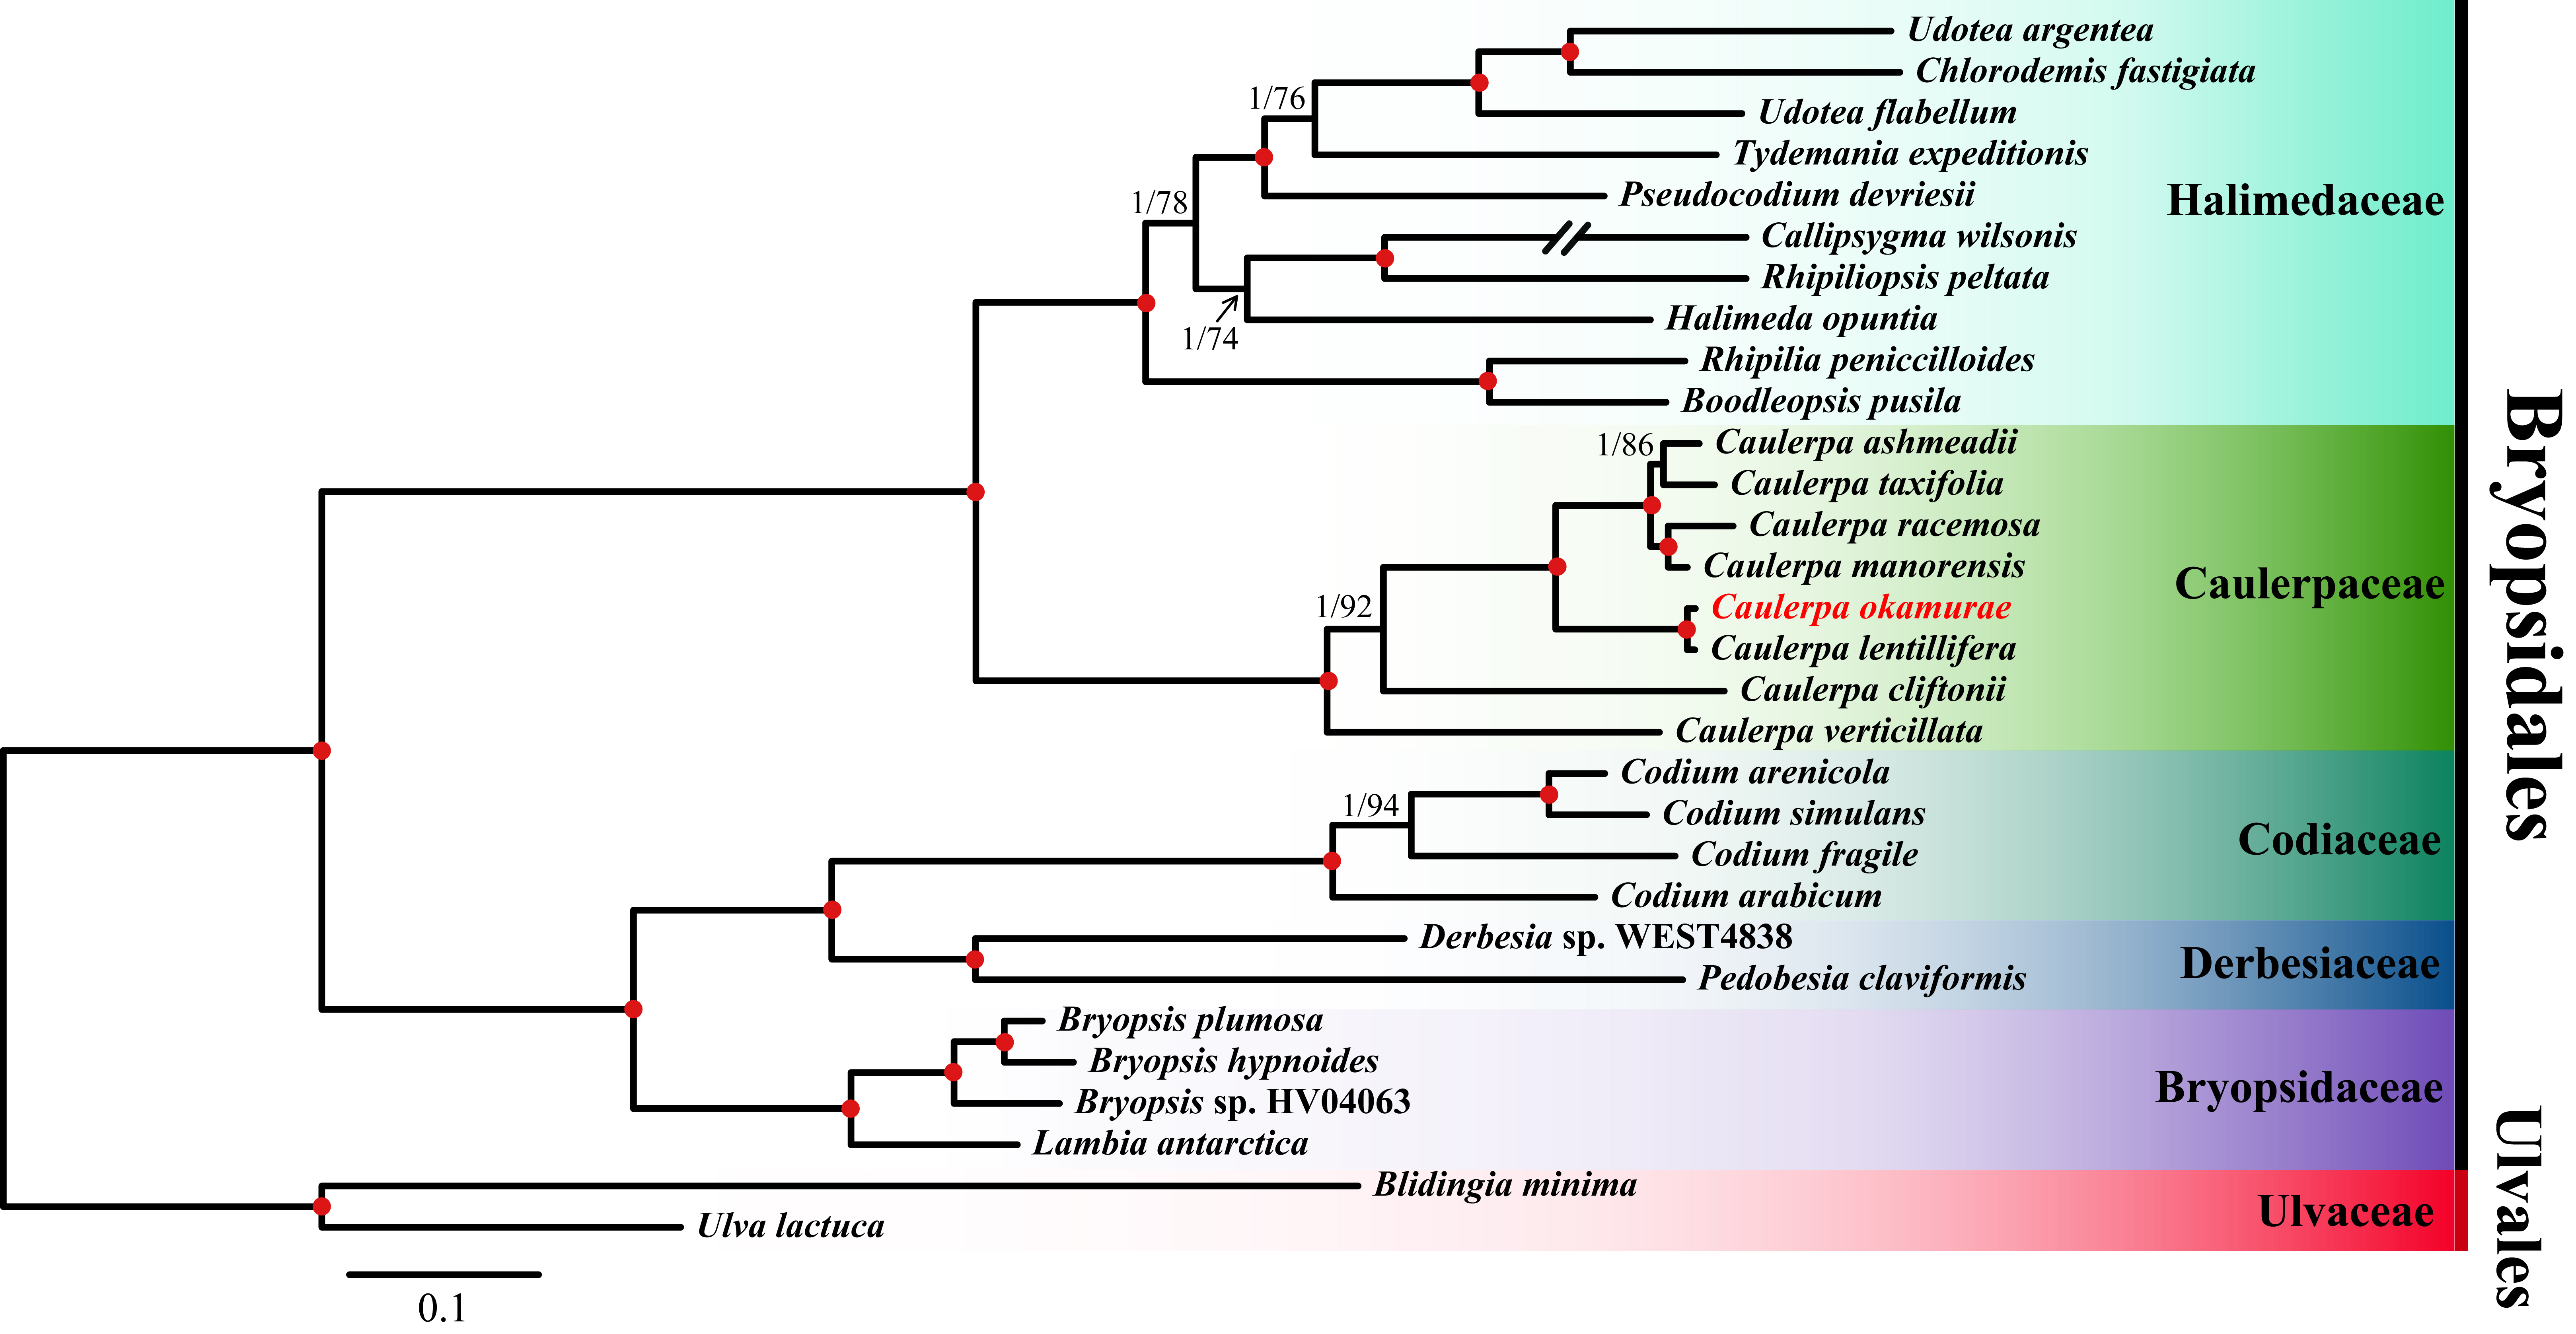
Figure S6. Phylogenetic tree reconstructed using chloroplast (cp) amino acid sequences from 30 green macrophyte taxa comprising six Ulvophyceae families: Halimedaceae, Caulerpaceae, Codiaceae, Derbesiaceae, Bryopsidaceae, and Ulvaceae (used as the outgroup). Species and CP gene information is provided in Tables S4 and S5. Caulerpa okamurae’s mRNA sequences were extracted and translated into amino acid sequences using TransDecoder (ver. 5.5.0), depending on the previous annotation. Node labels indicate posterior probabilities and bootstrap support values obtained from Bayesian inference (BI) and Maximum likelihood (MaxL) analyses, respectively. Support values of 1.00 and 100% for BI and MaxL, respectively, are represented as red dots.
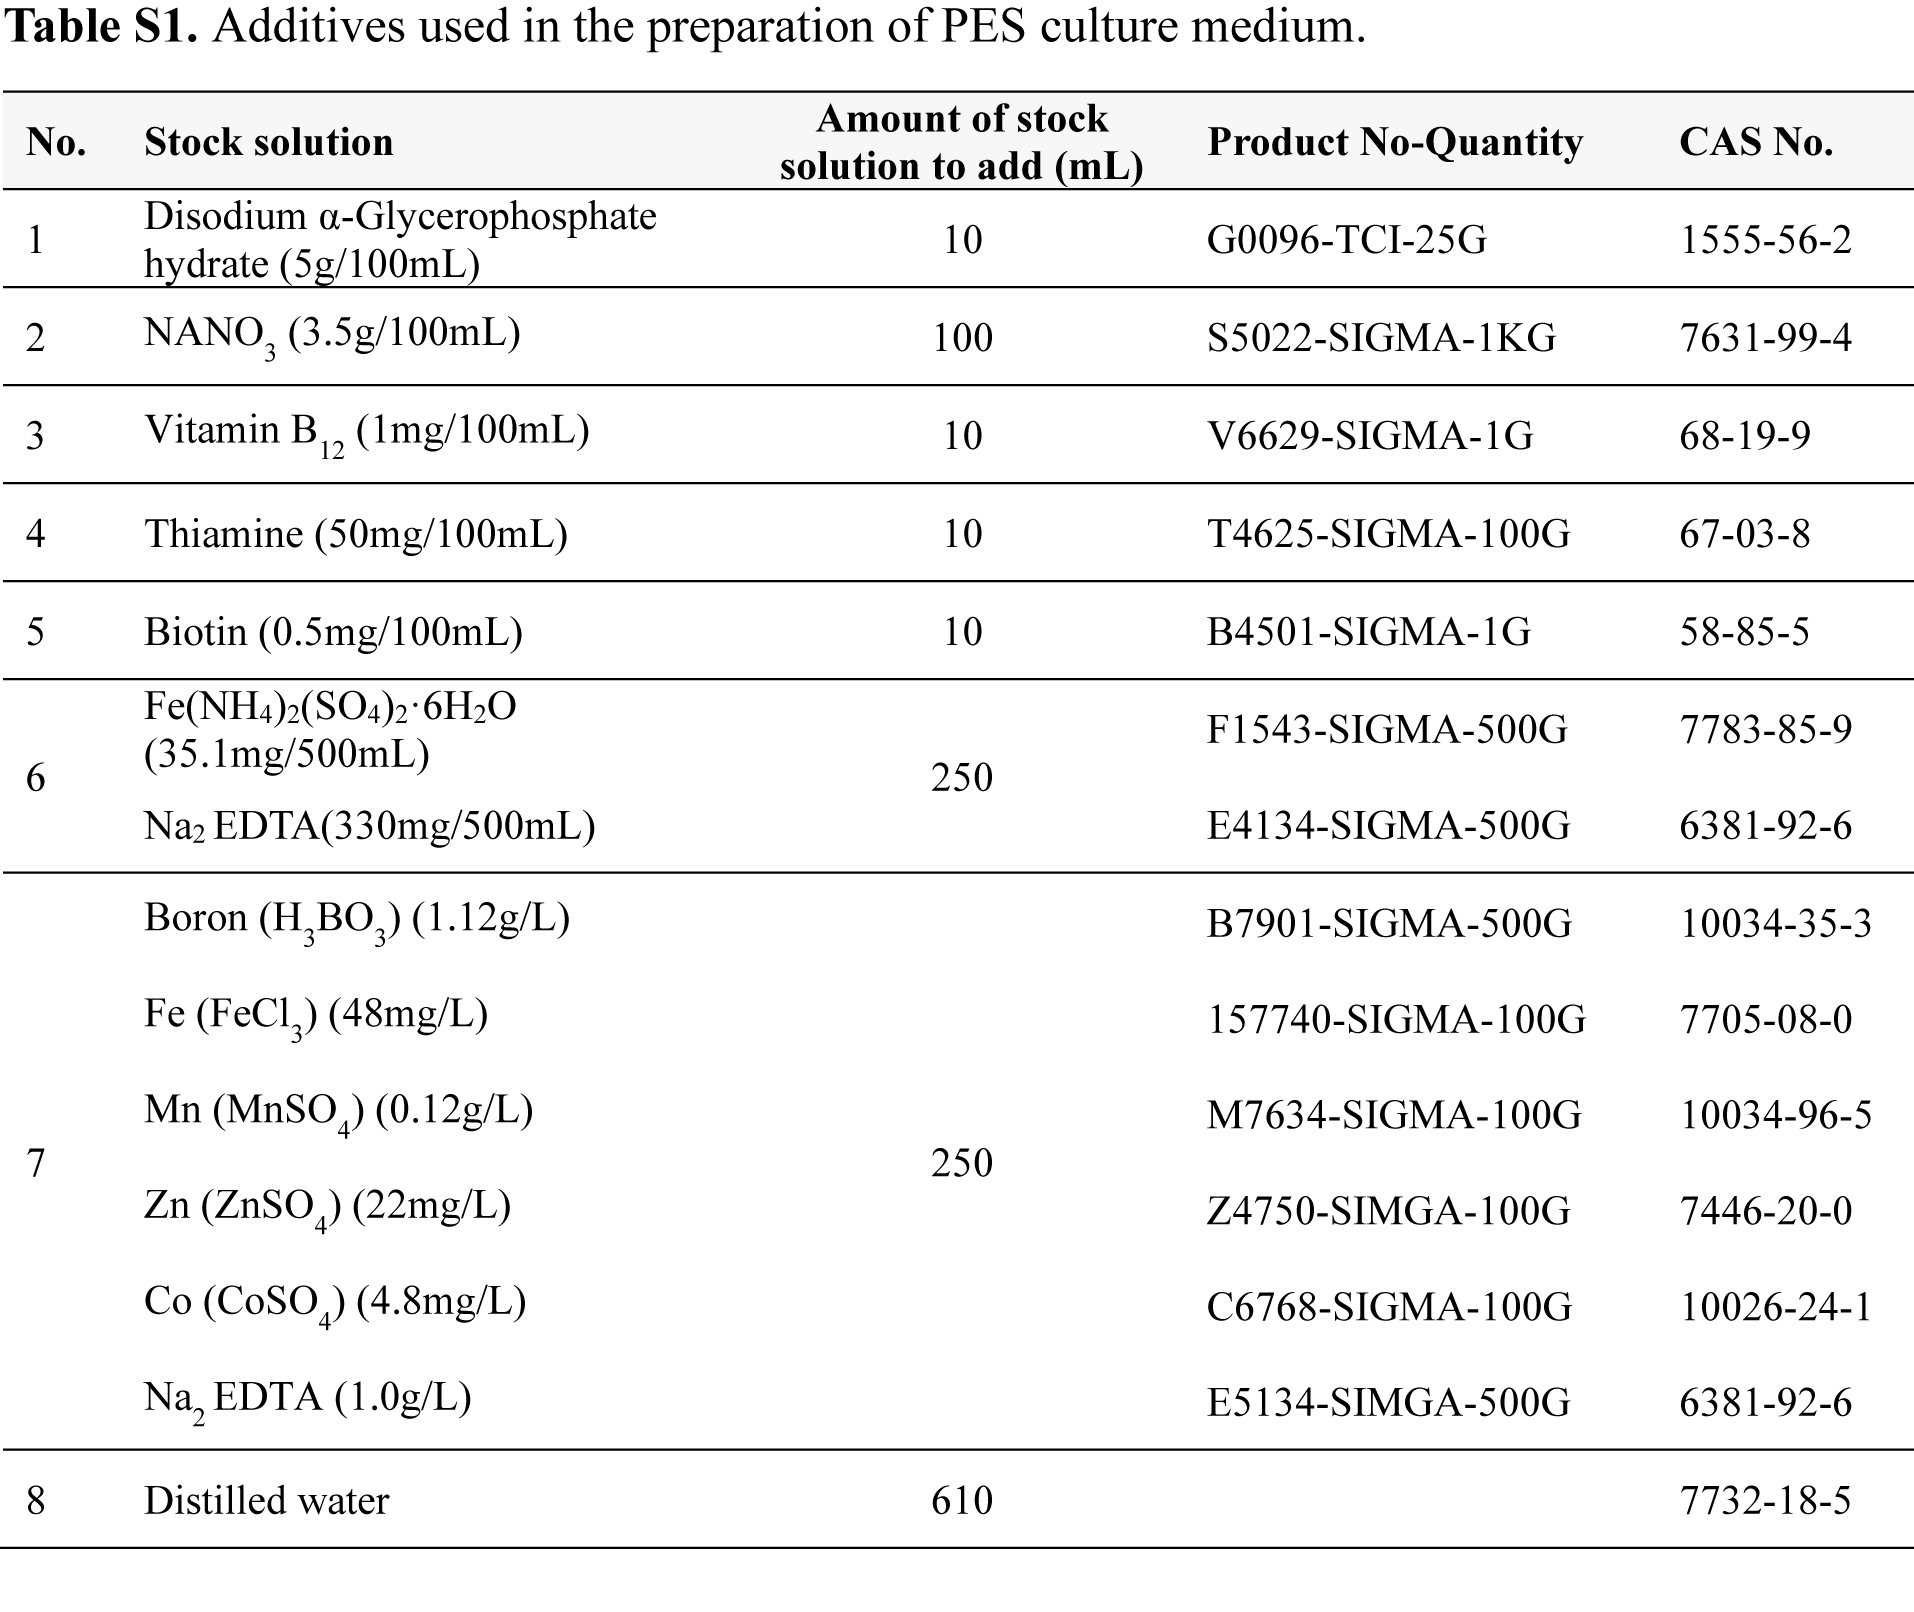
Table S1. Additives used in the preparation of PES culture medium.
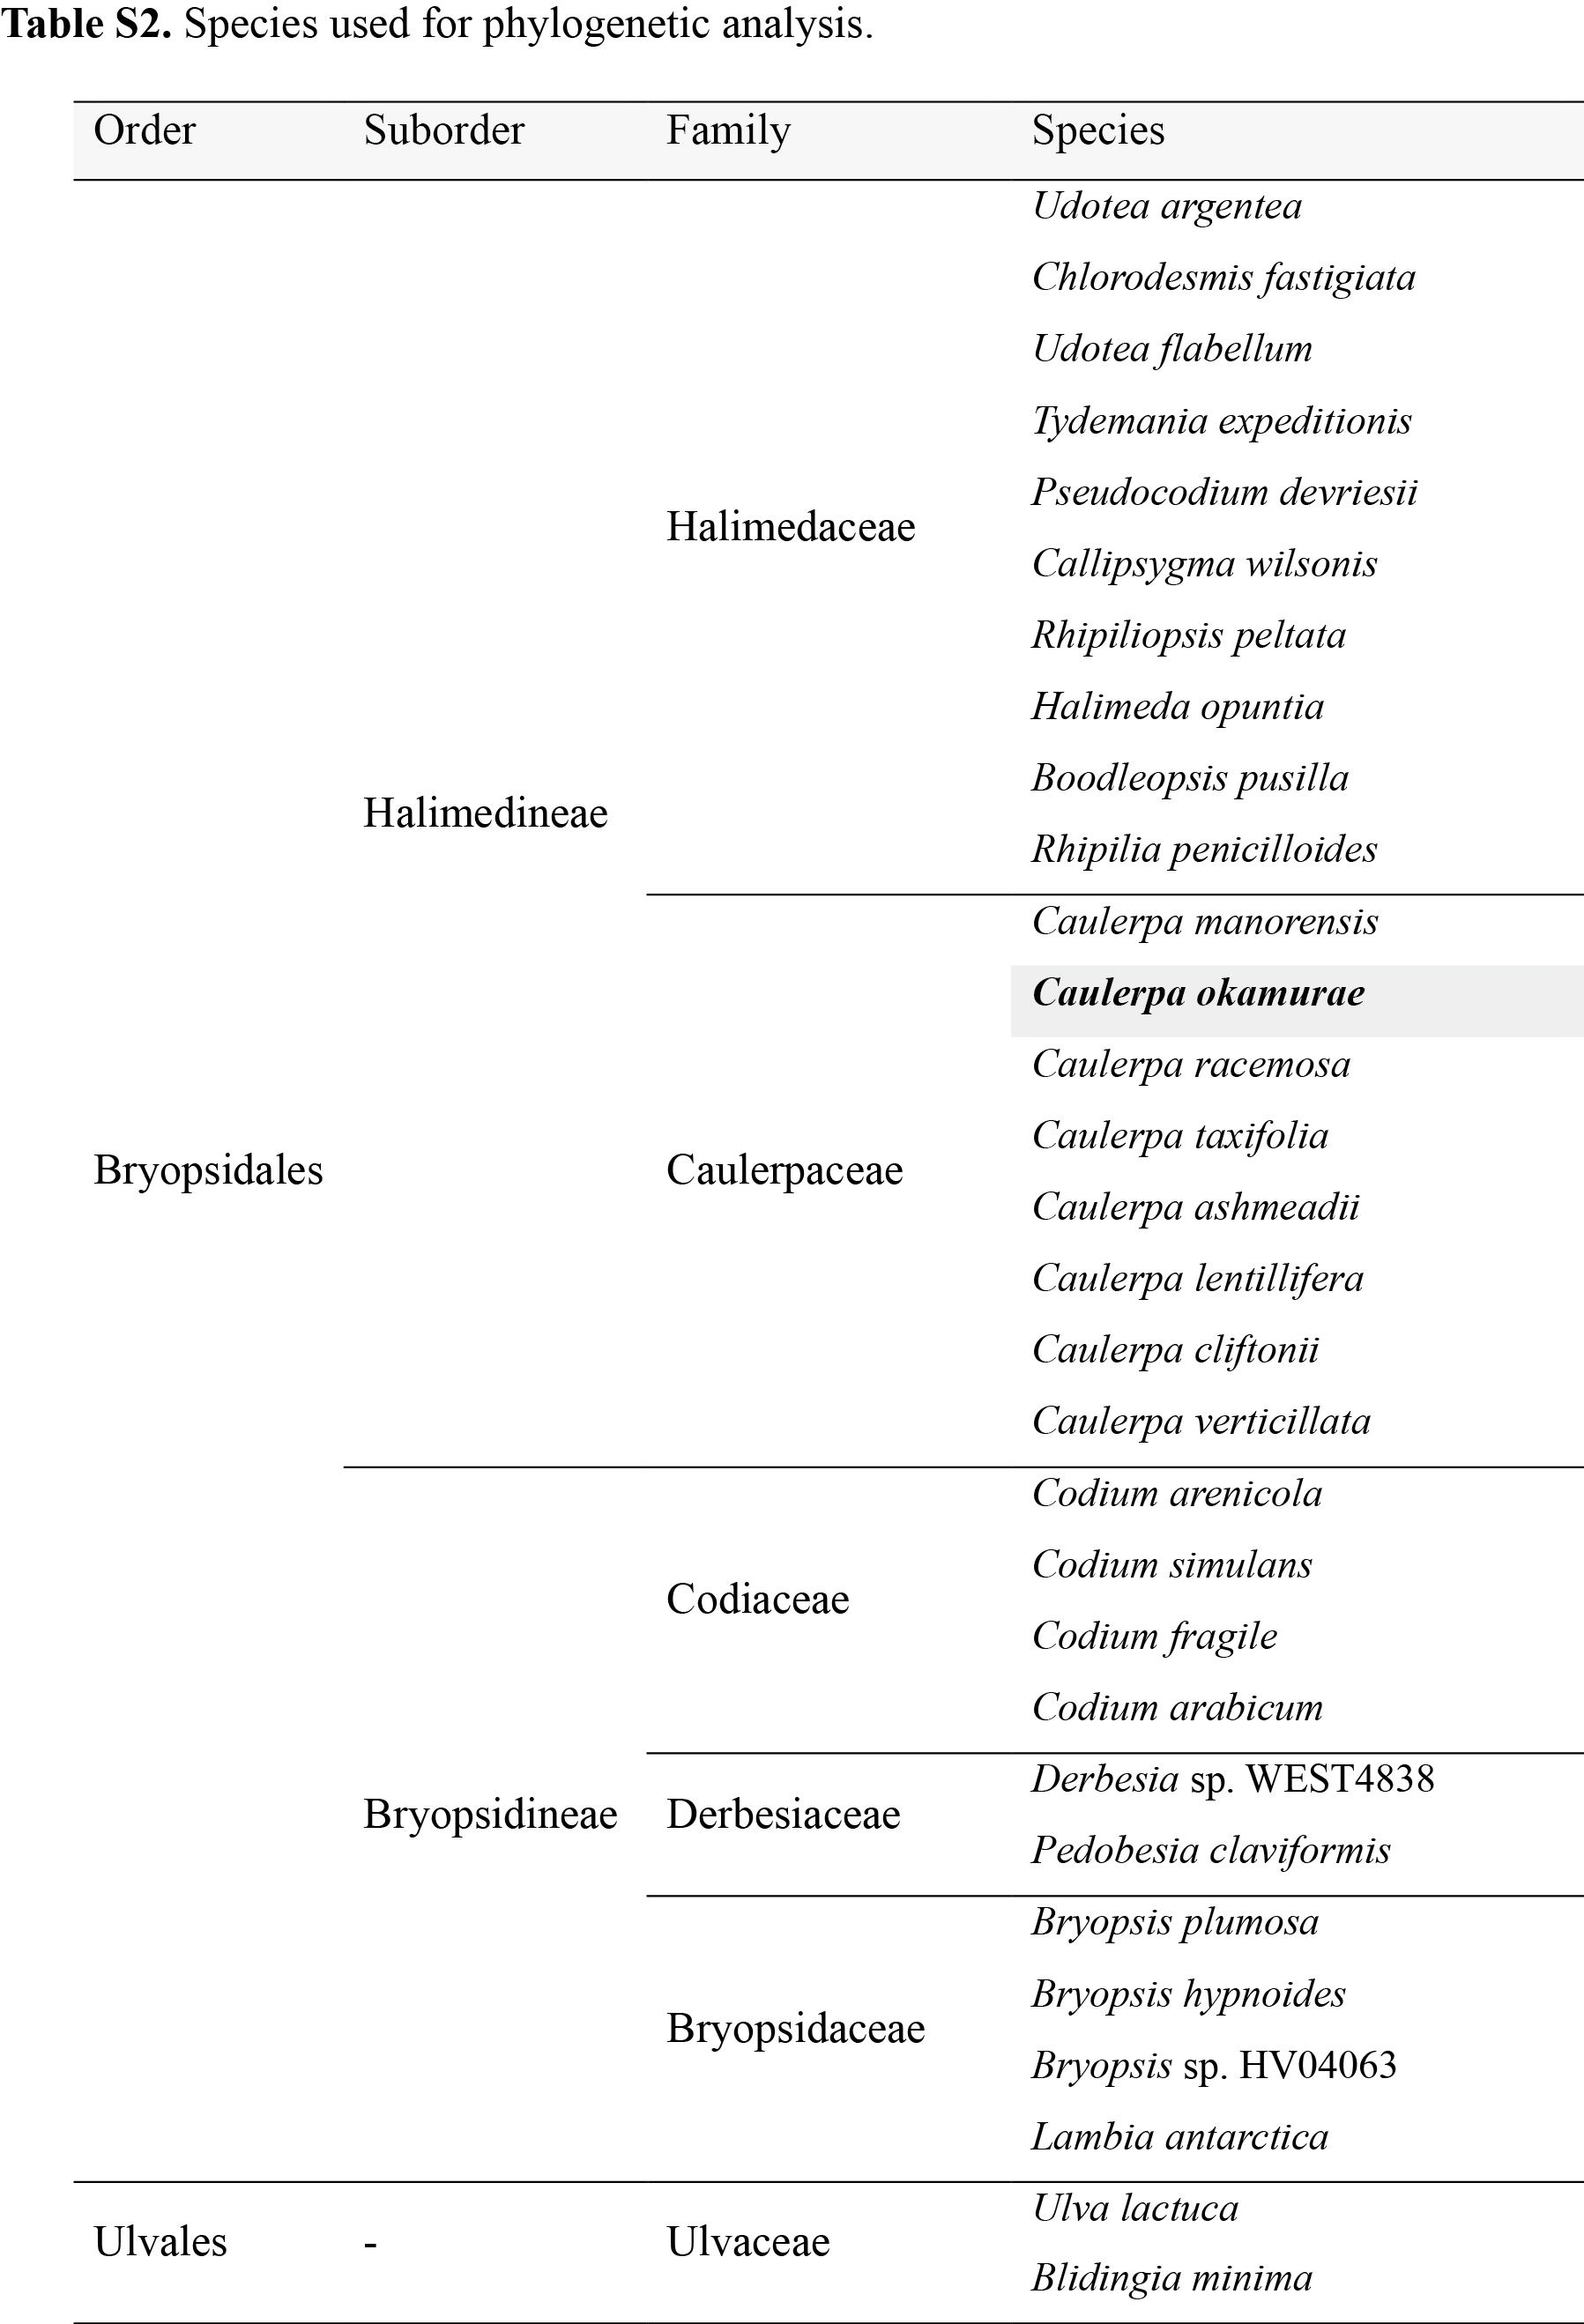
Table S2. Species used for phylogenetic analysis.
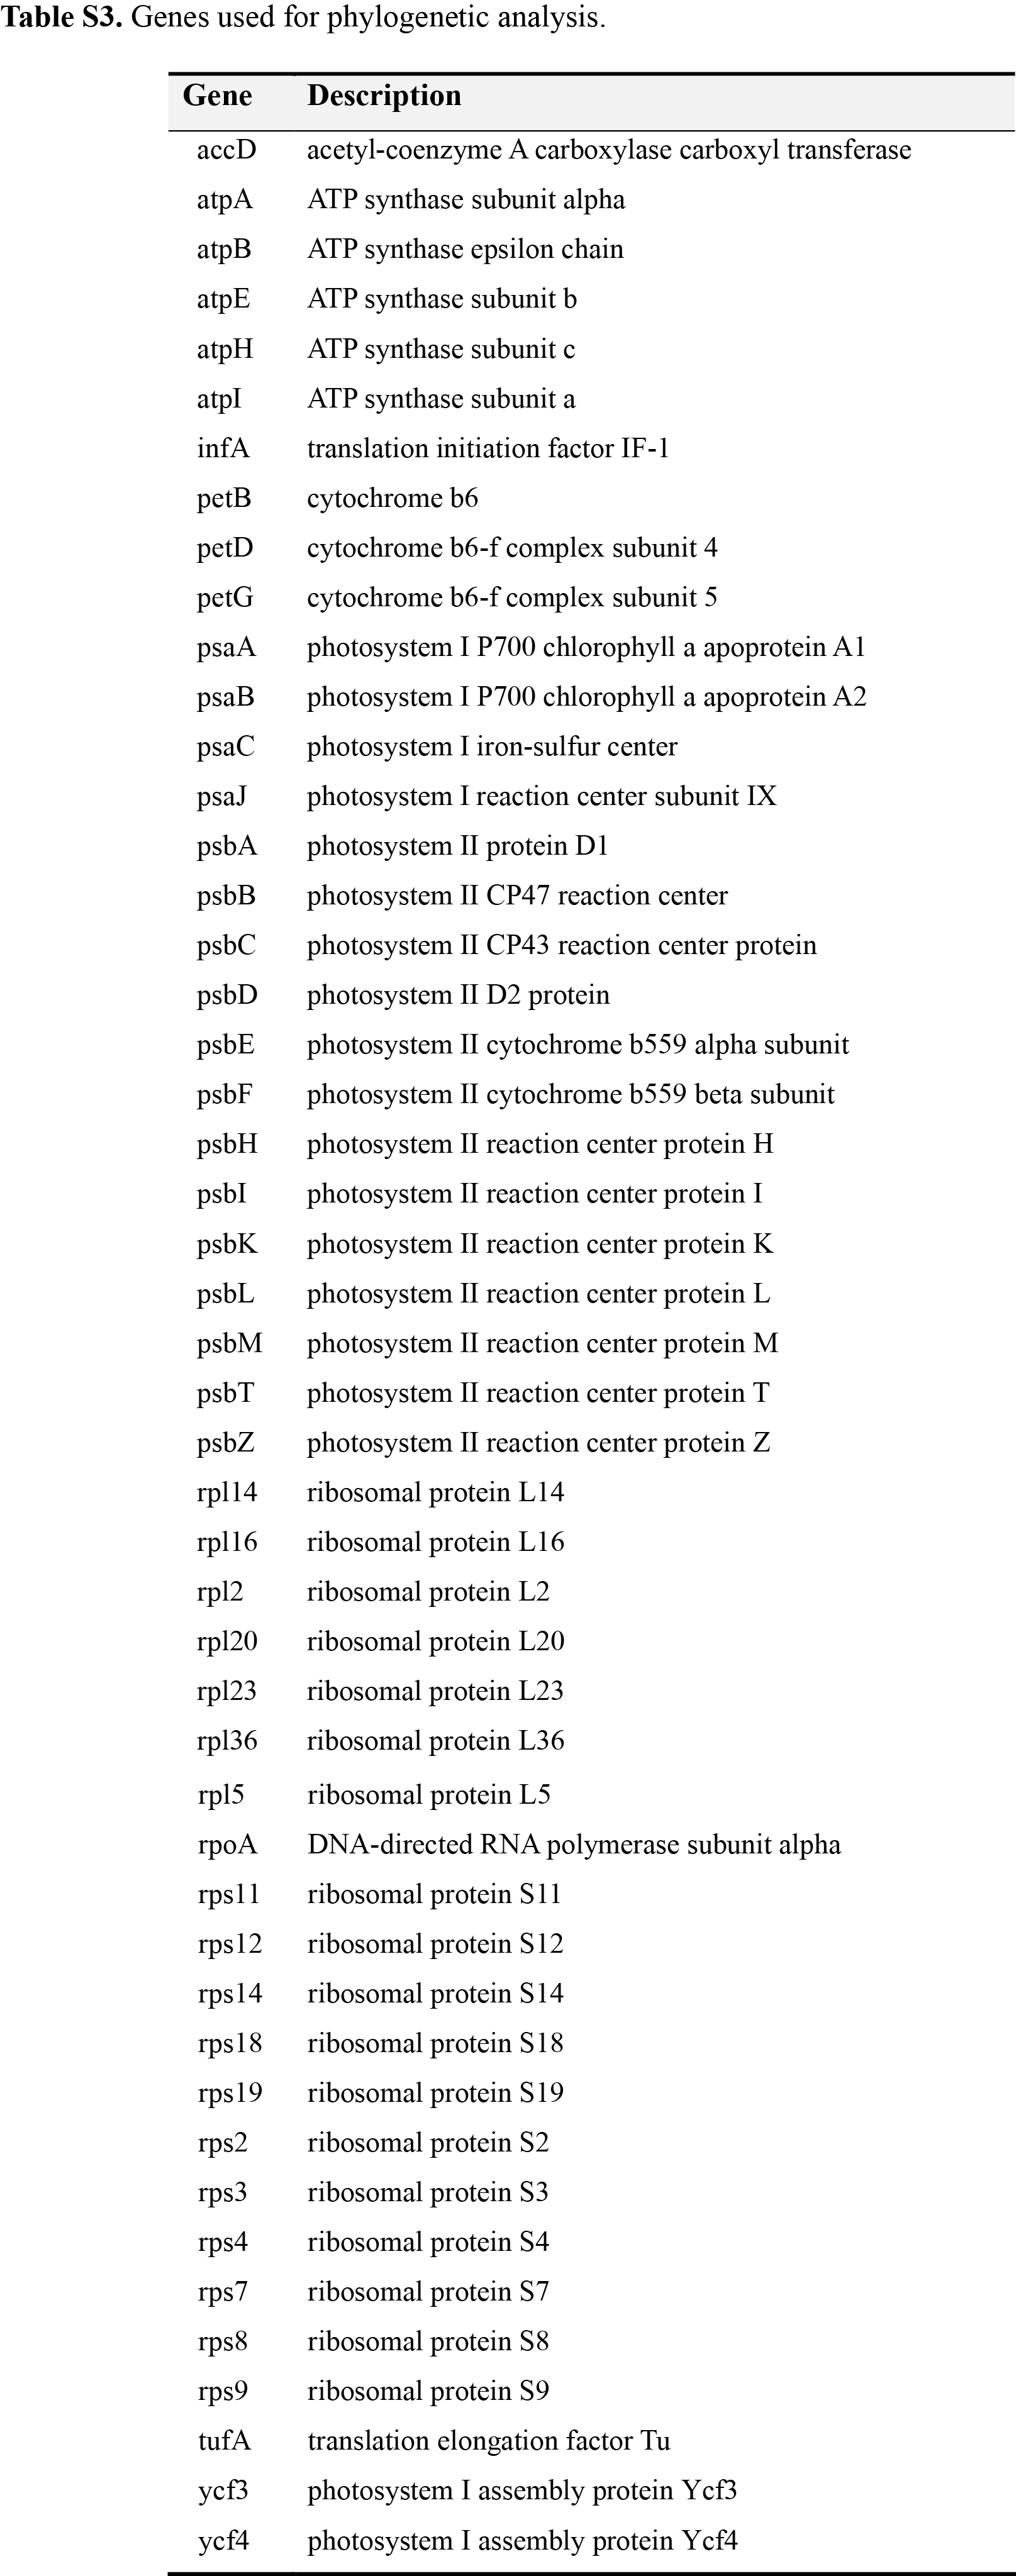
Table S3. Genes used for phylogenetic analysis.
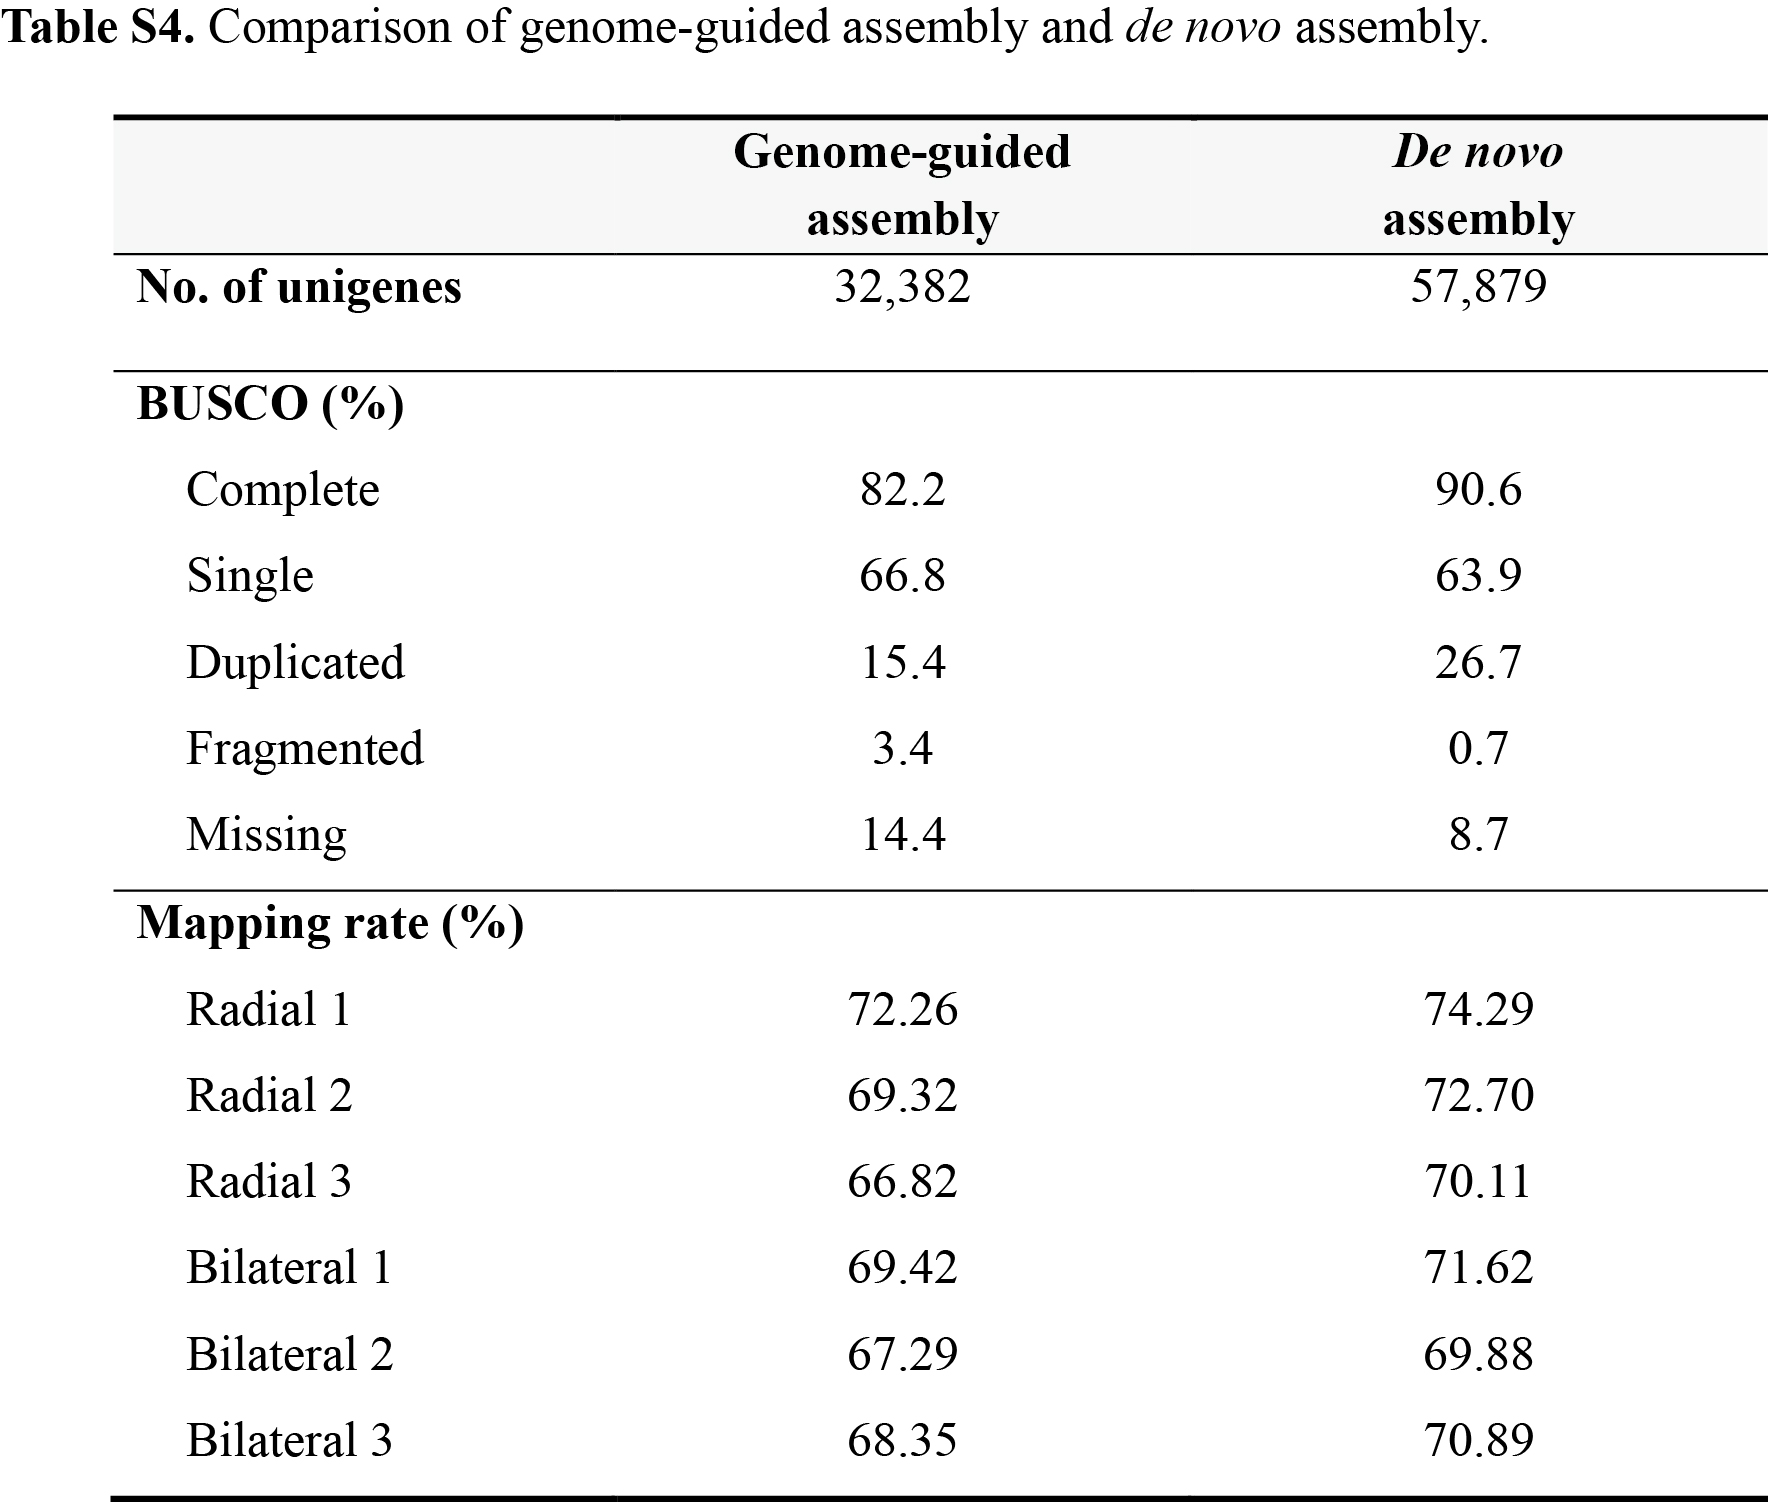
Table S4. Comparison of genome-guided transcriptome assembly and de novo assembly.
- Supporting File 1. Annotated GO terms and KEGG pathways for unigenes.
- Supporting File 2. Enriched GO terms and KEGG pathways for DEGs.