Genome assembly, gene content, and plastic gene expression responses to salinity changes in the Brackishwater Clam (Corbicula japonica) from a dynamic estuarine environment
Choi H, An Y, Lee CJ, Song C, Kim EJ, Lee CE, Cho SJ, Eyun S
Journal of Hazardous Materials 483:136627

— Figures and Tables (Colored and High resolution) —
Figure 1. Gene family expansions and contractions of the brackishwater clam, relative to 12 molluscans and two outgroup species. (a) Location of the sampling site along the Seomjingang River (red dot). The map was created on QGIS software (ver. 3.26.2, https://www.qgis.org) using OpenStreetMap (https://www.openstreetmap.org/copyright). (b) Shell of the brackishwater clam, Corbicula japonica (1.5 cm). (c) Phylogenetic tree constructed using single-copy orthologues from 14 lophotrochozoan species (including 12 molluscan species) showing the position of C. japonica (highlighted in red). The numbers in black on the right side of each node represent divergence times, while red and blue numbers represent the number of gene families undergoing significant expansion and contraction (p < 0.05), respectively. The time scale is indicated in million years ago (Ma) and displayed at the bottom.
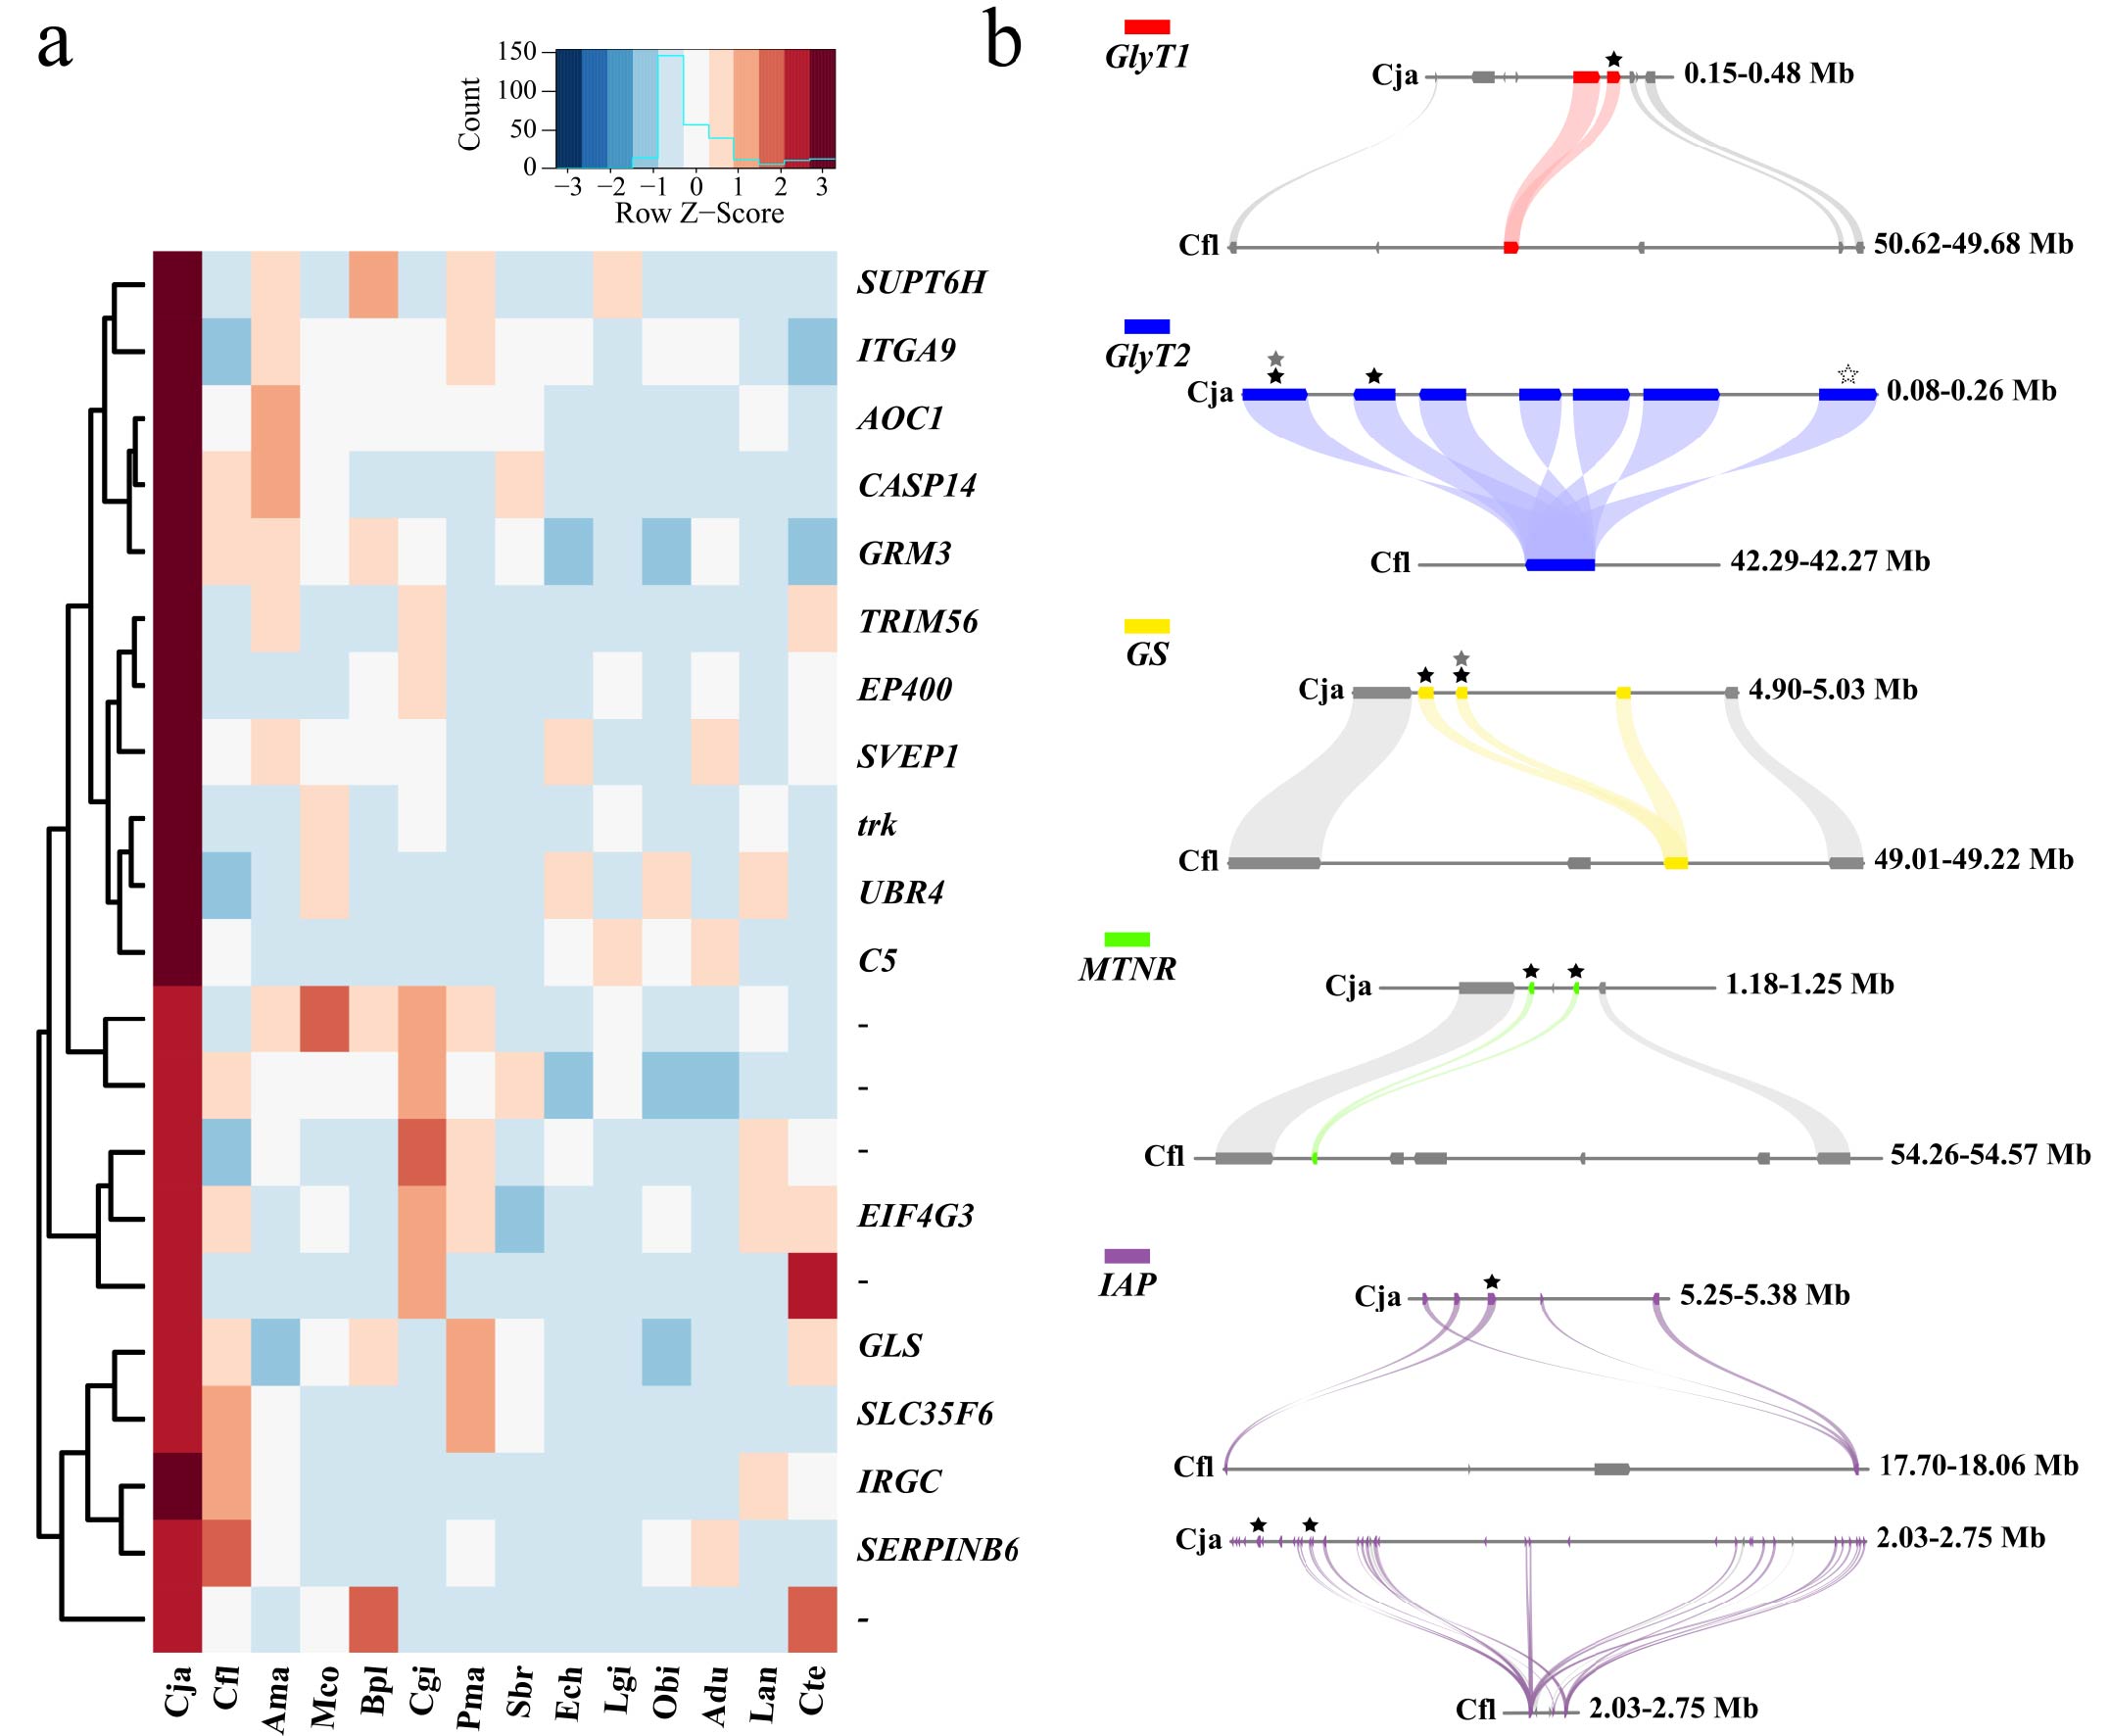
Figure 2. Gene family expansion and tandem repeats in the brackishwater clam genome. (a) Heat map of gene families that are significantly expanded (p < 0.05) and enriched (Z-score > 1.96) in Corbicula japonica compared with 13 lophotrochozoans. (b) Microsynteny analysis of the brackishwater and freshwater clam genomes showing GlyT1 (red), GlyT2 (blue), GS (yellow), MTNR (green), and IAP (purple) genes, which are arrayed in tandem repeats in the genome of brackishwater clam. Genes upregulated in high and low salinity groups were denoted by black and dashed stars, respectively. The gray star on each corresponding gene indicated stained genes. Abbreviation: Cja, Corbicula japonica; Cfl, Corbicula fluminea; Ama, Archivesica marissinica; Mco, Mytilus coruscus; Bpl, Bathymodiolus platifrons; Cgi, Crassostrea gigas; Pma, Pecten maximus; Sbr, Scapharca broughtonii; Ech, Elysia chlorotica; Lgi, Lottia gigantea; Obi, Octopus bimaculoides; Adu, Architeuthis dux; Lan, Lingula anatina; Cte, Capitella teleta.
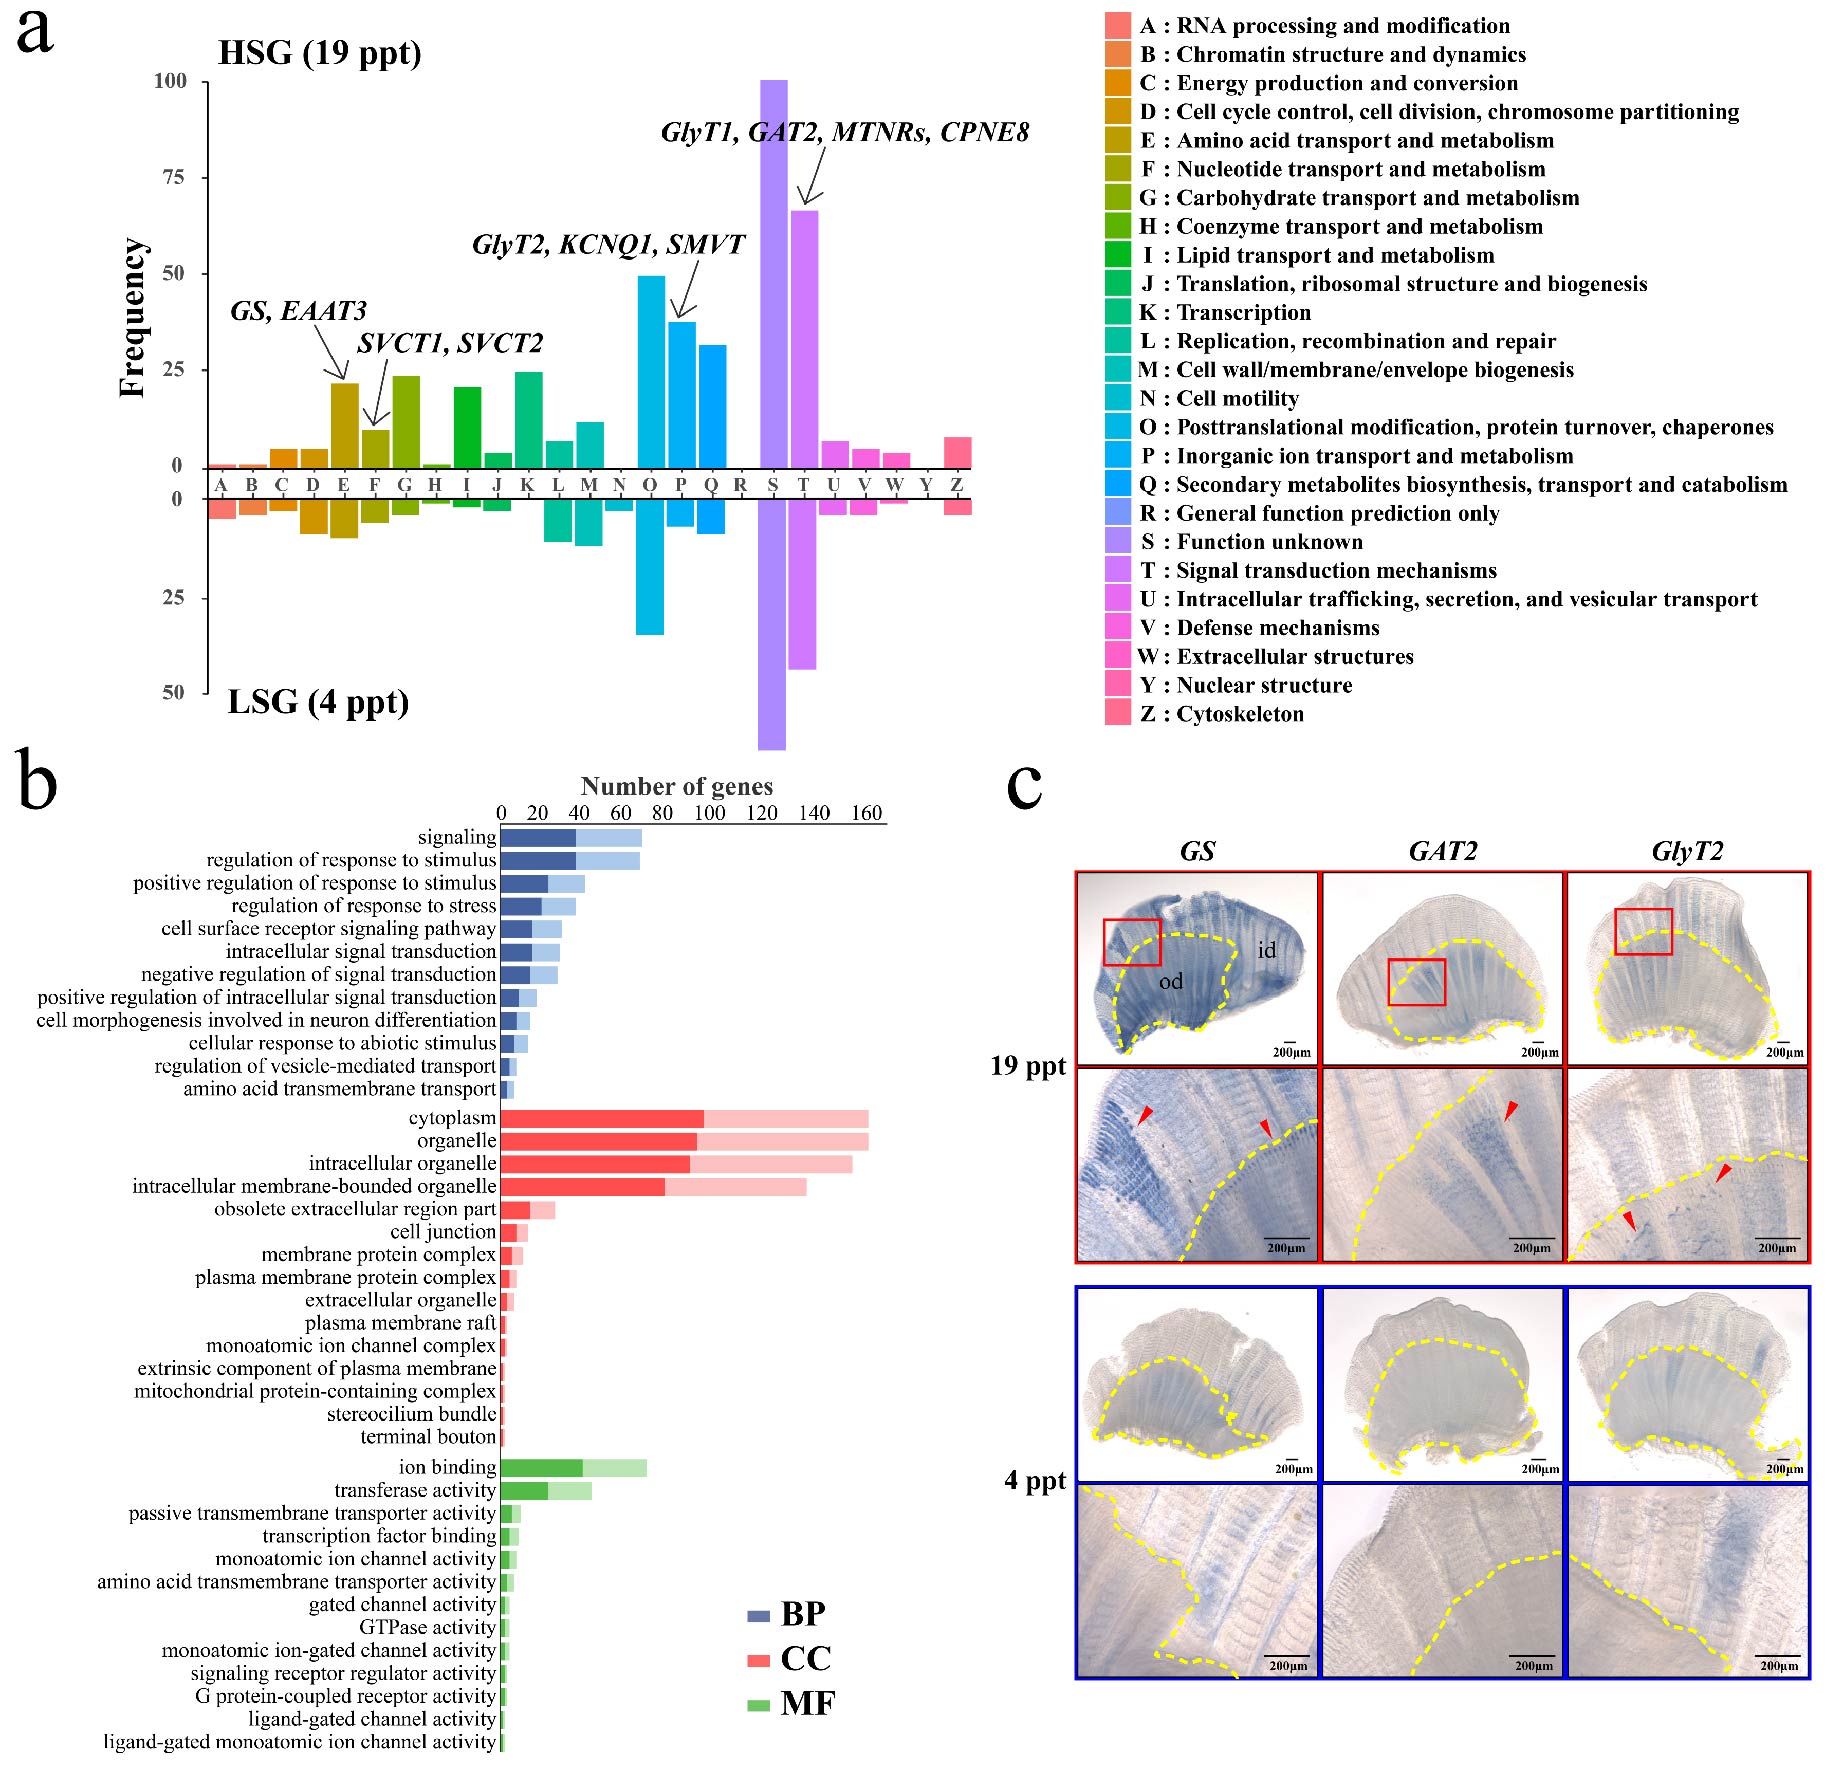
Figure 3. Fig. 3. Gene expression dynamics under high salinity and low salinity groups. (a) KOG analysis shows distinct expression profiles in the high salinity group (HSG, 19 ppt) and the low salinity group (LSG, 4 ppt). (b) GO term analysis of HSG and LSG. Significant GO terms related to the nervous system in HSG are shown (p < 0.05). Genes found in 19 ppt are indicated in a lighter shade, while those in 4 ppt are shown in a darker color. Abbreviations: BP, biological process; CC, cellular component. (c) Whole-mount in situ hybridization of brackishwater clam gills, visualizing gills after hybridization with anti-sense RNA probes of GS, GAT2, and GlyT2. Blue NBT/BCIP is indicative of mRNA expression. Images were taken using a Zeiss microscope Axio Zoom V16. Abbreviations: od, outer demibranch; id, inner demibranch. Red arrows and yellow dotted lines represent the mRNA expression regions and outer demibranch regions, respectively. Scale bar, 200 μm. The expression of three genes in HSG was analyzed in two independent experiments.
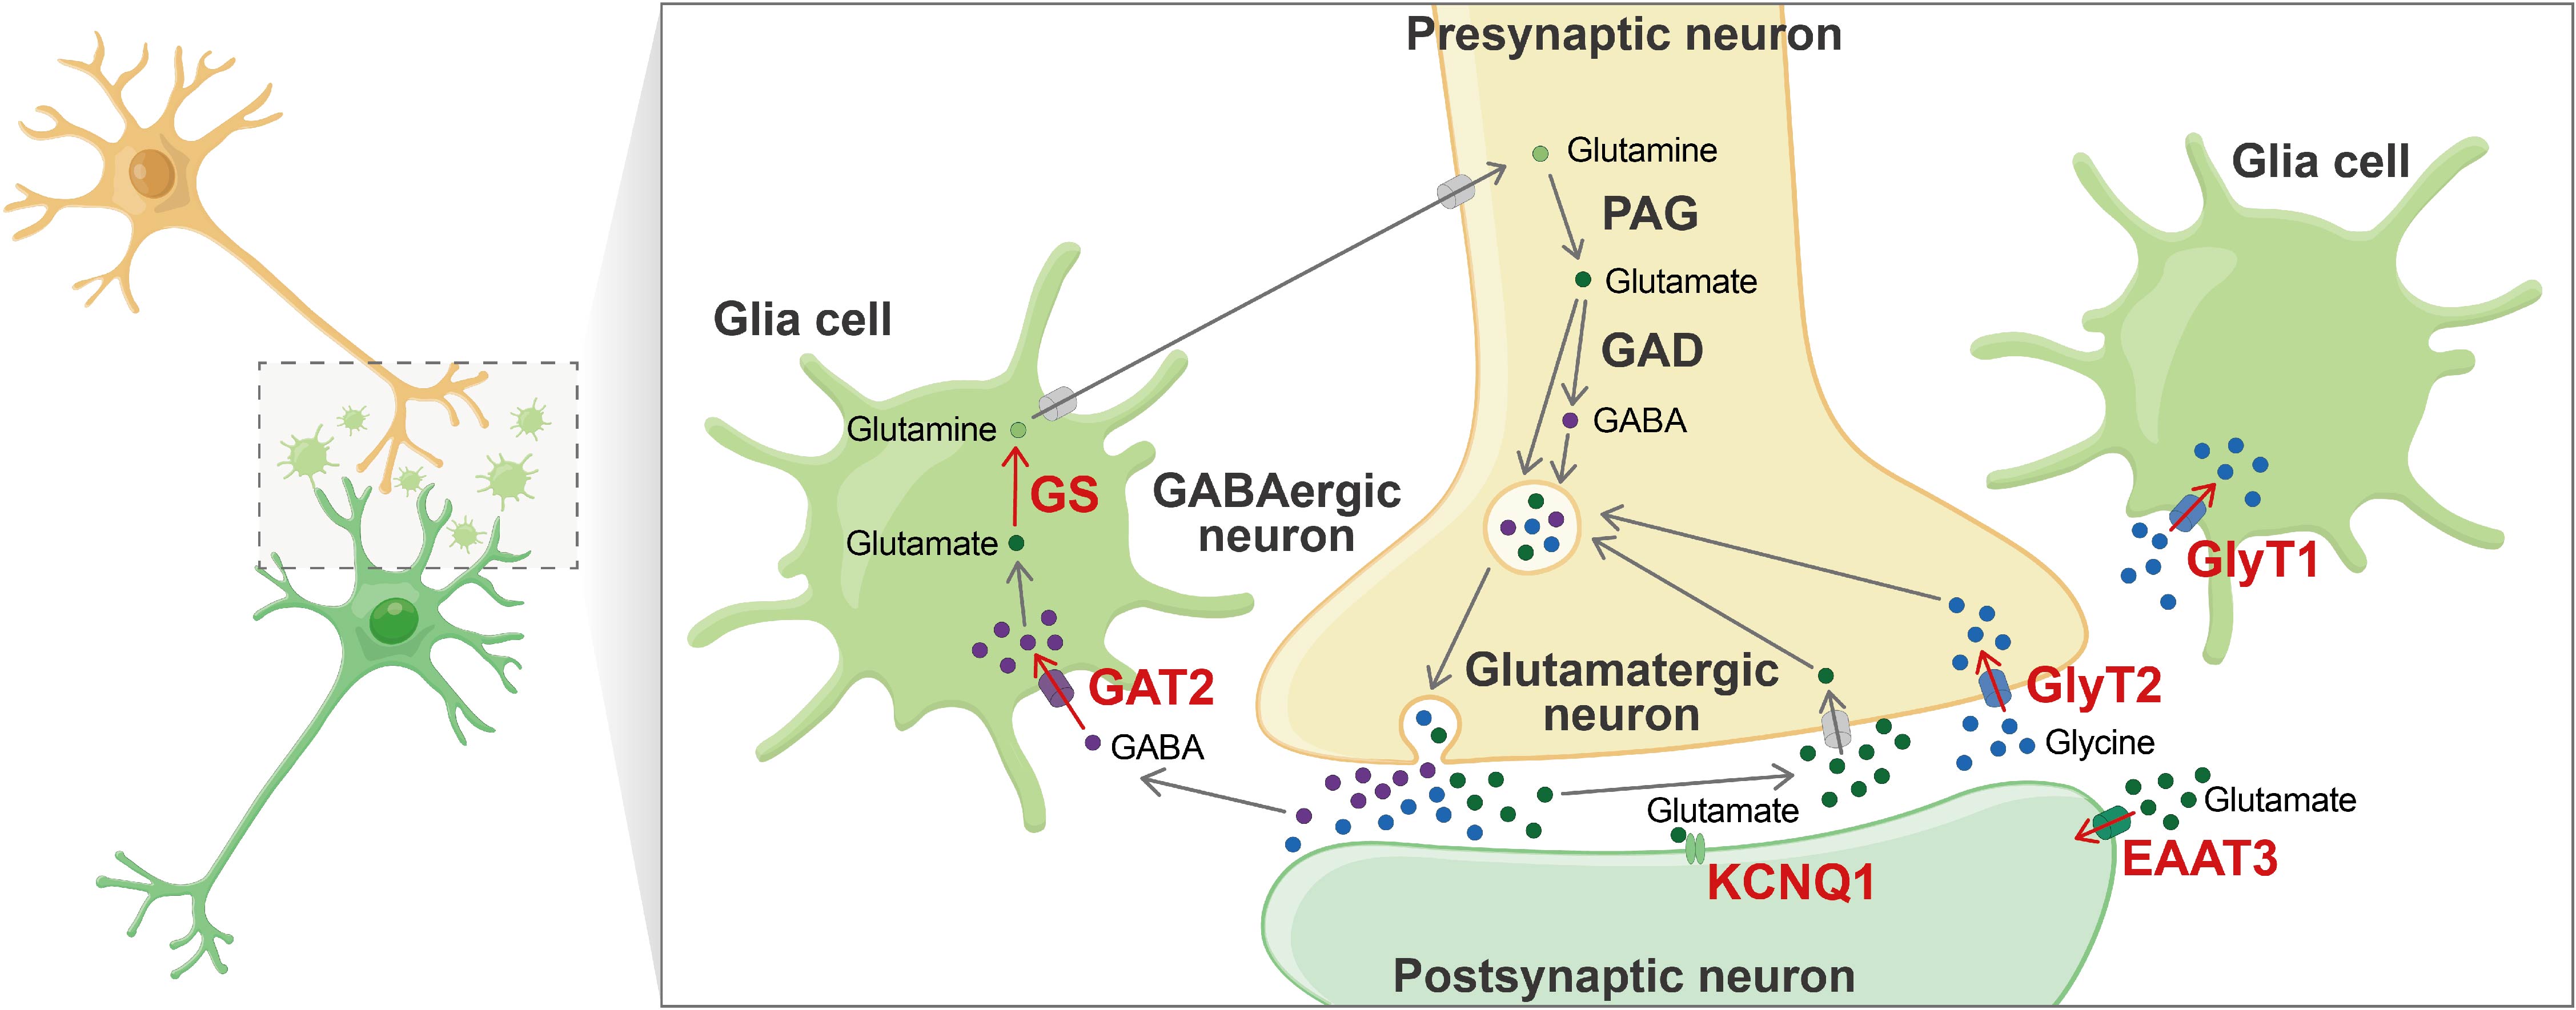
Figure 4. Hypothesized model of the brackishwater clams under salt stress. A glutamate/GABA-glutamine and glycine cycle in the brackishwater clam is depicted. When salinity increases, neurotransmitters (GABA) involved in excitation are rapidly reabsorbed back into the presynaptic glial cell by GAT2. In the glial cell, the neurotransmitters are converted into glutamine by glutamine synthase (GS) and transferred back to the presynaptic neuron. In the presynaptic neuron, glutamine is reconverted to glutamate by phosphate-activated glutaminase (PAG). In glutamatergic neurons, glutamate is secreted directly, whereas in GABAergic neurons, it is converted to GABA by glutamate decarboxylase (GAD), which is then secreted. For continuous signal propagation, KCNQ1 mediates repolarization. GlyT1 and GlyT2 mediate the clearance of glycine from the space between presynaptic and postsynaptic neurons. Upregulated genes identified by transcriptome analysis and the direction of neurotransmitter movement are shown in red.

— Supporting Information (Colored and High resolution) —
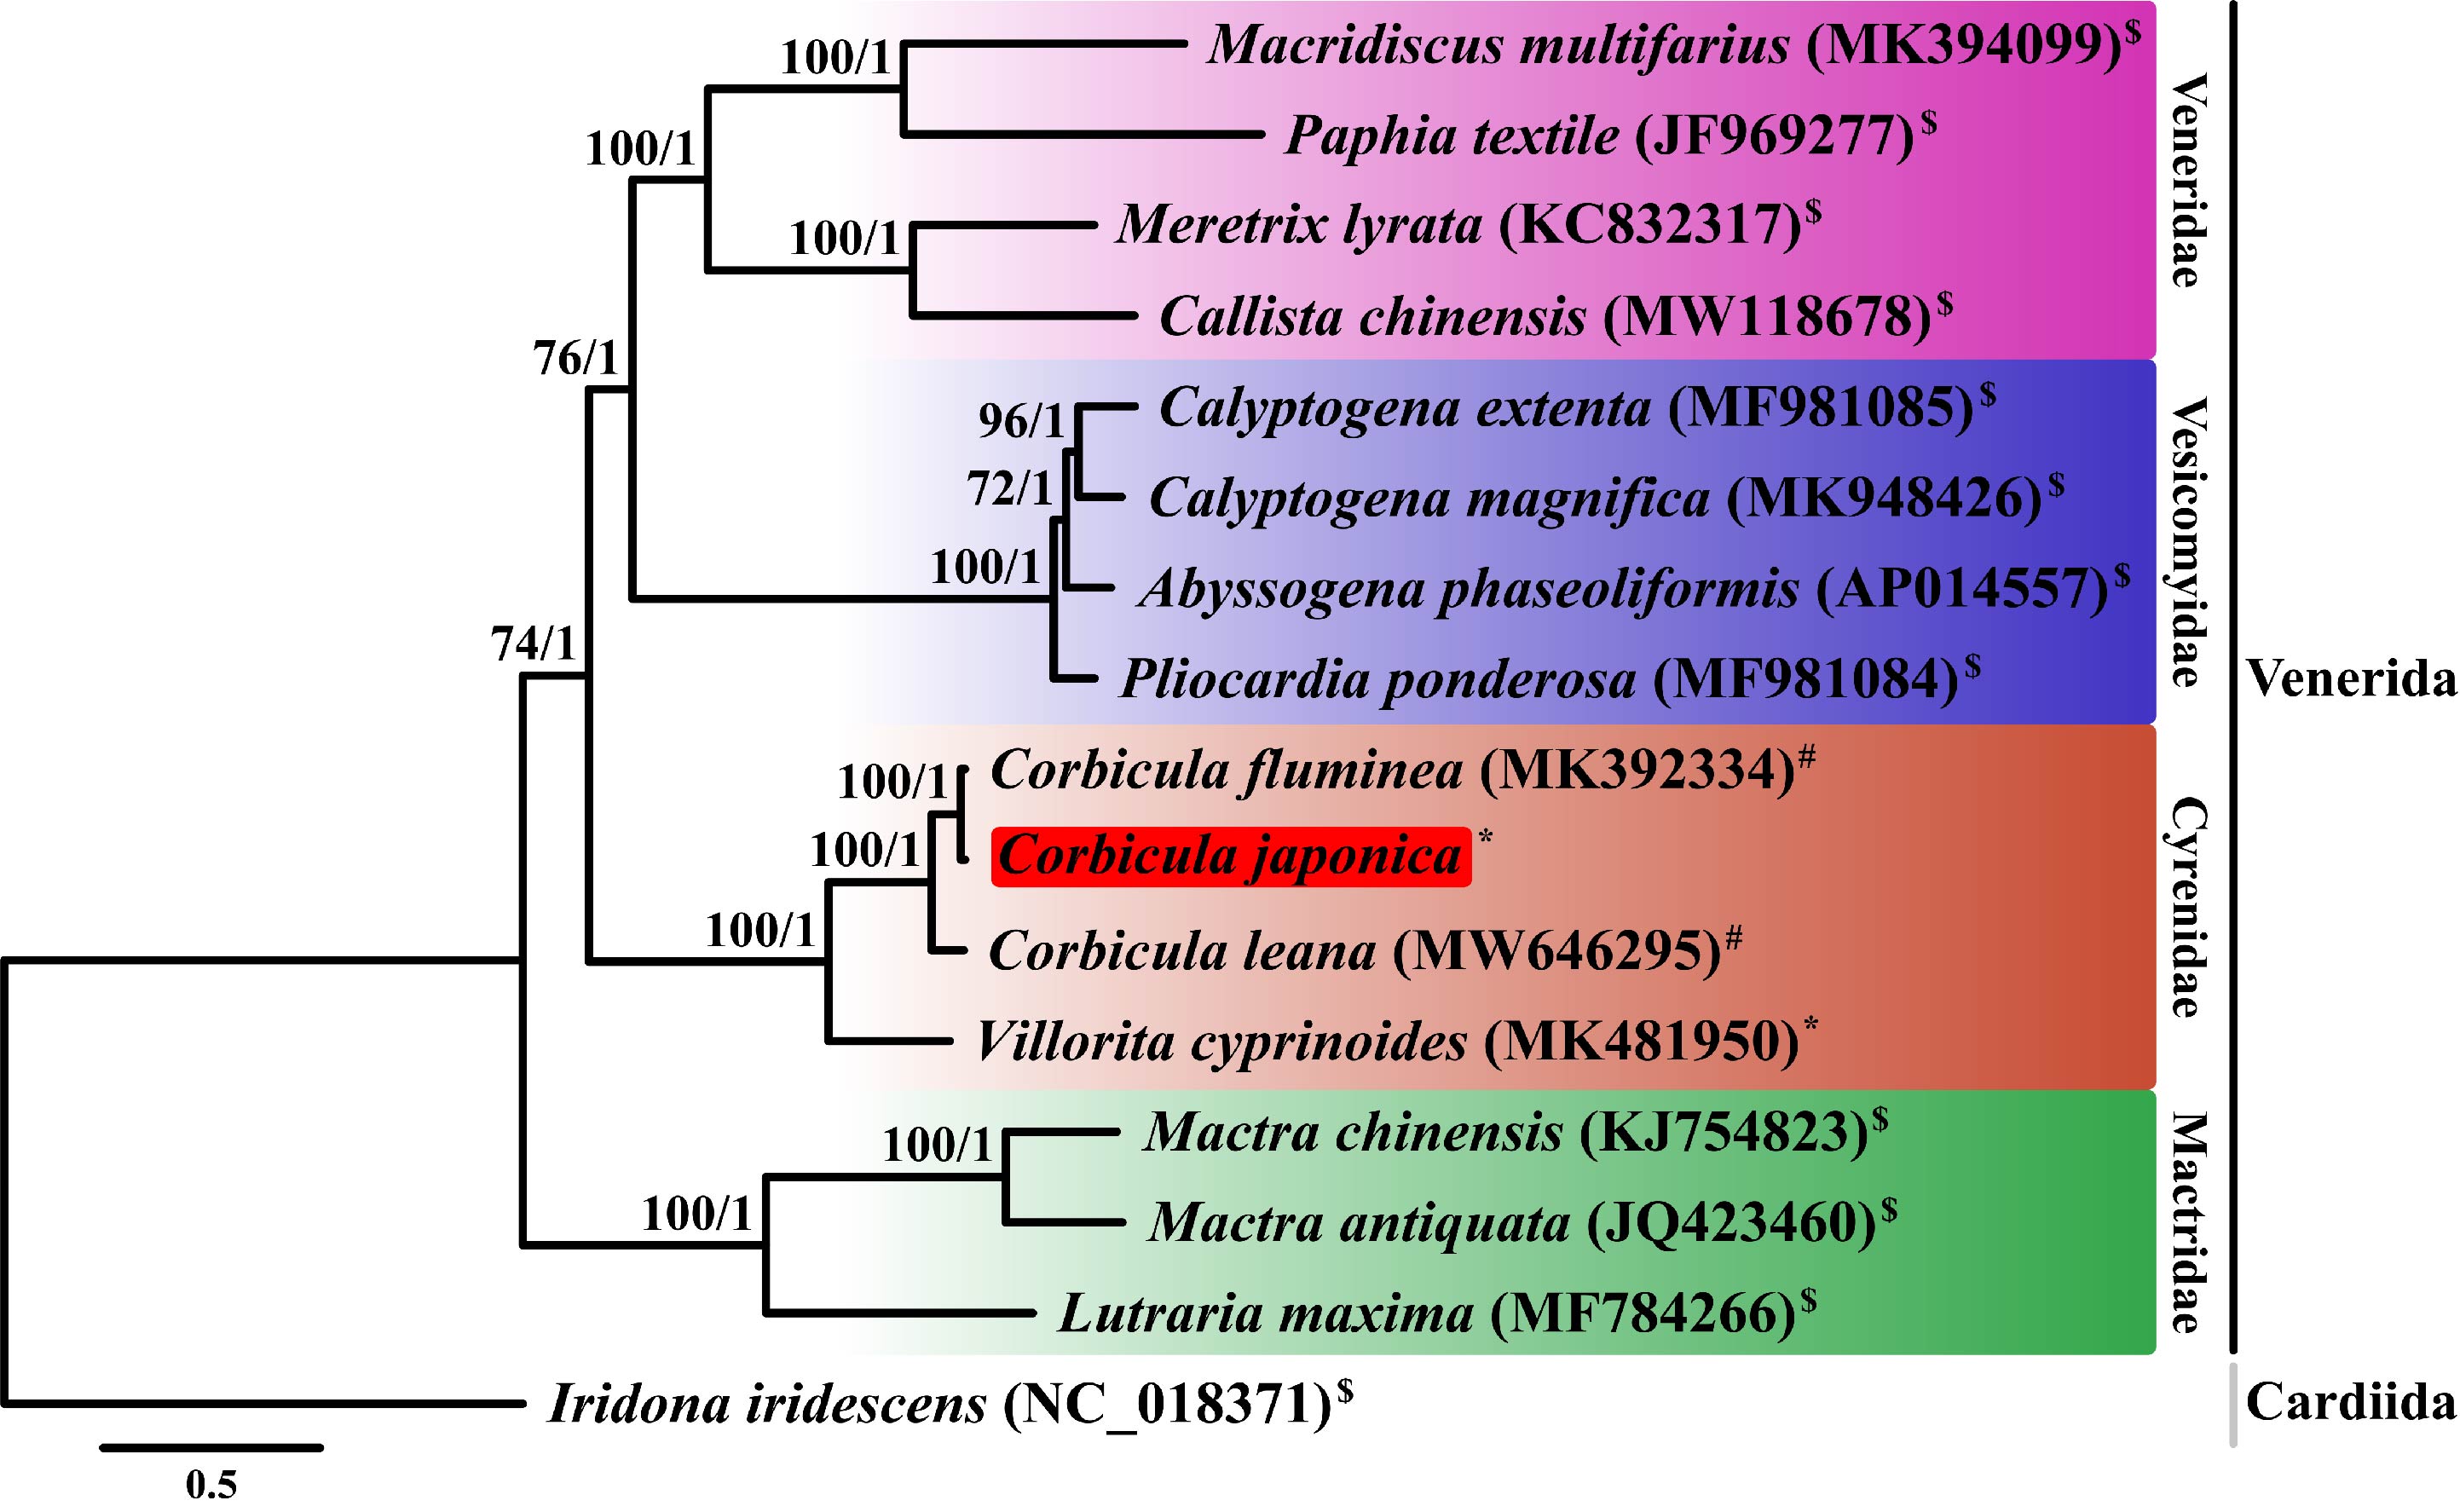
Figure S1. The maximum likelihood (ML) phylogeny of 16 bivalves, including Iridona iridescens (family Cardiida) as an outgroup. The branches with the bootstrap support values (left) and Bayesian inference posterior probabilities (right) are shown at each node. The brackishwater clam is highlighted in red. Based on 13 protein-coding genes, the maximum likelihood tree suggests that our sample is closely related to Corbicula fluminea, which is a species of freshwater clam. Note that $, #, and * indicate the habitat of saltwater, freshwater, and brackishwater, respectively.
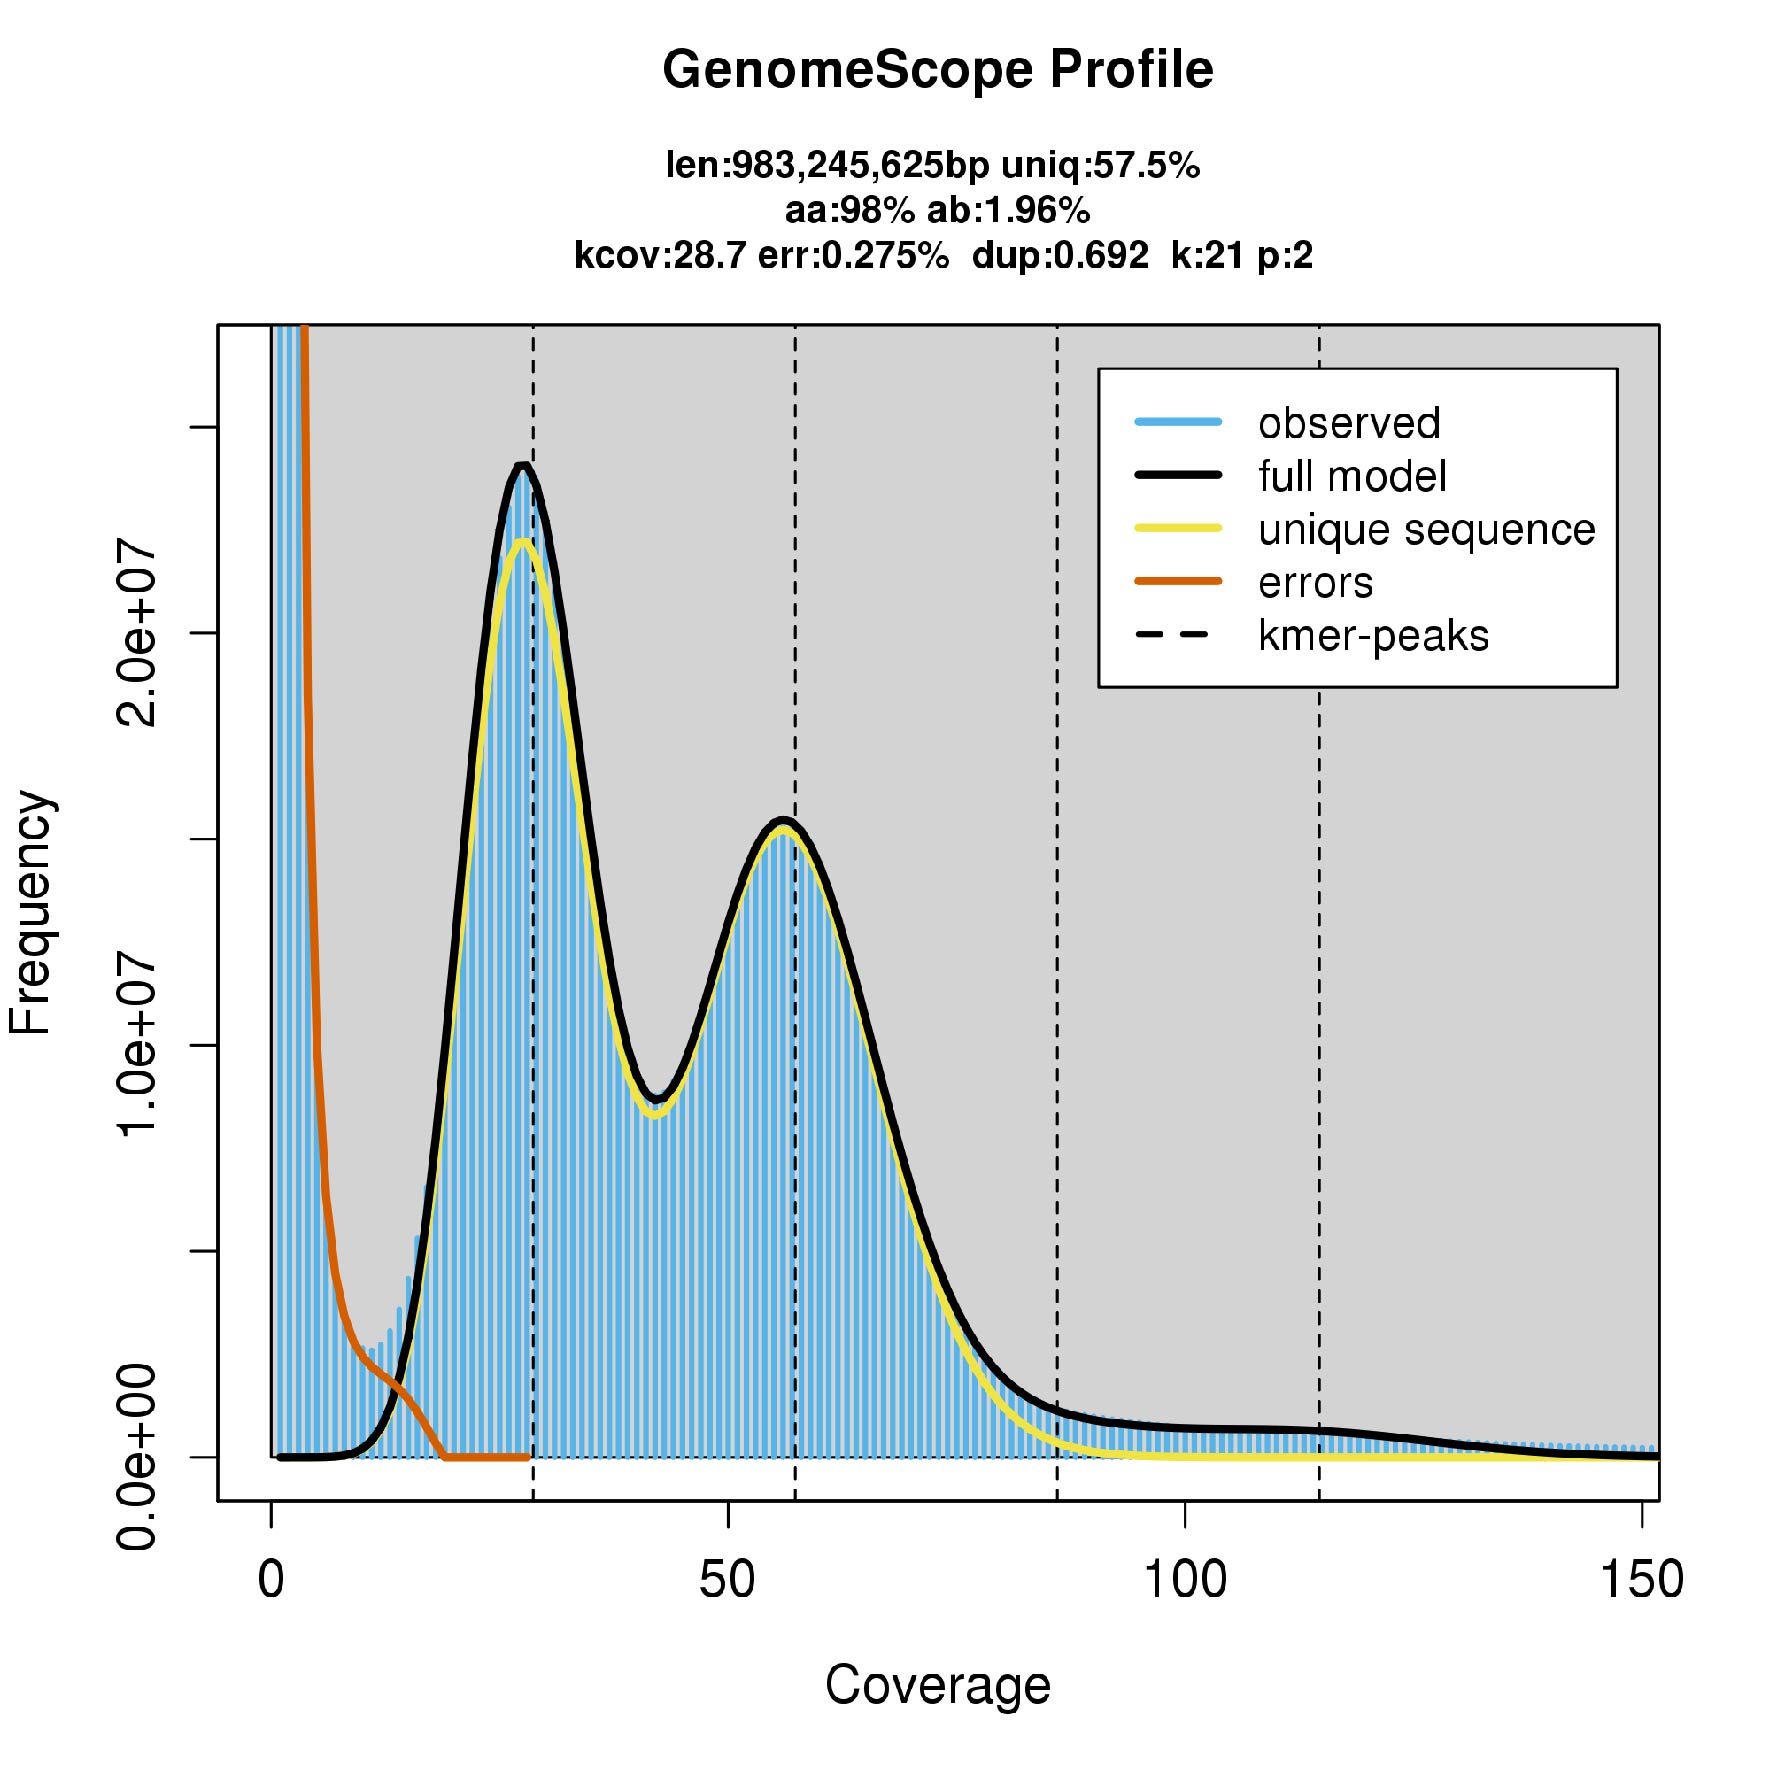
Figure S2. The genome size of the brackishwater clam was estimated to be 983 Mb using GenomeScope (http://qb.cshl.edu/genomescope) using 21-mers generated with Jellyfish (ver. 2.3.0). The heterozygosity is estimated to be 1.96% with the homozygous peak at 28 and heterozygous peak at 56.
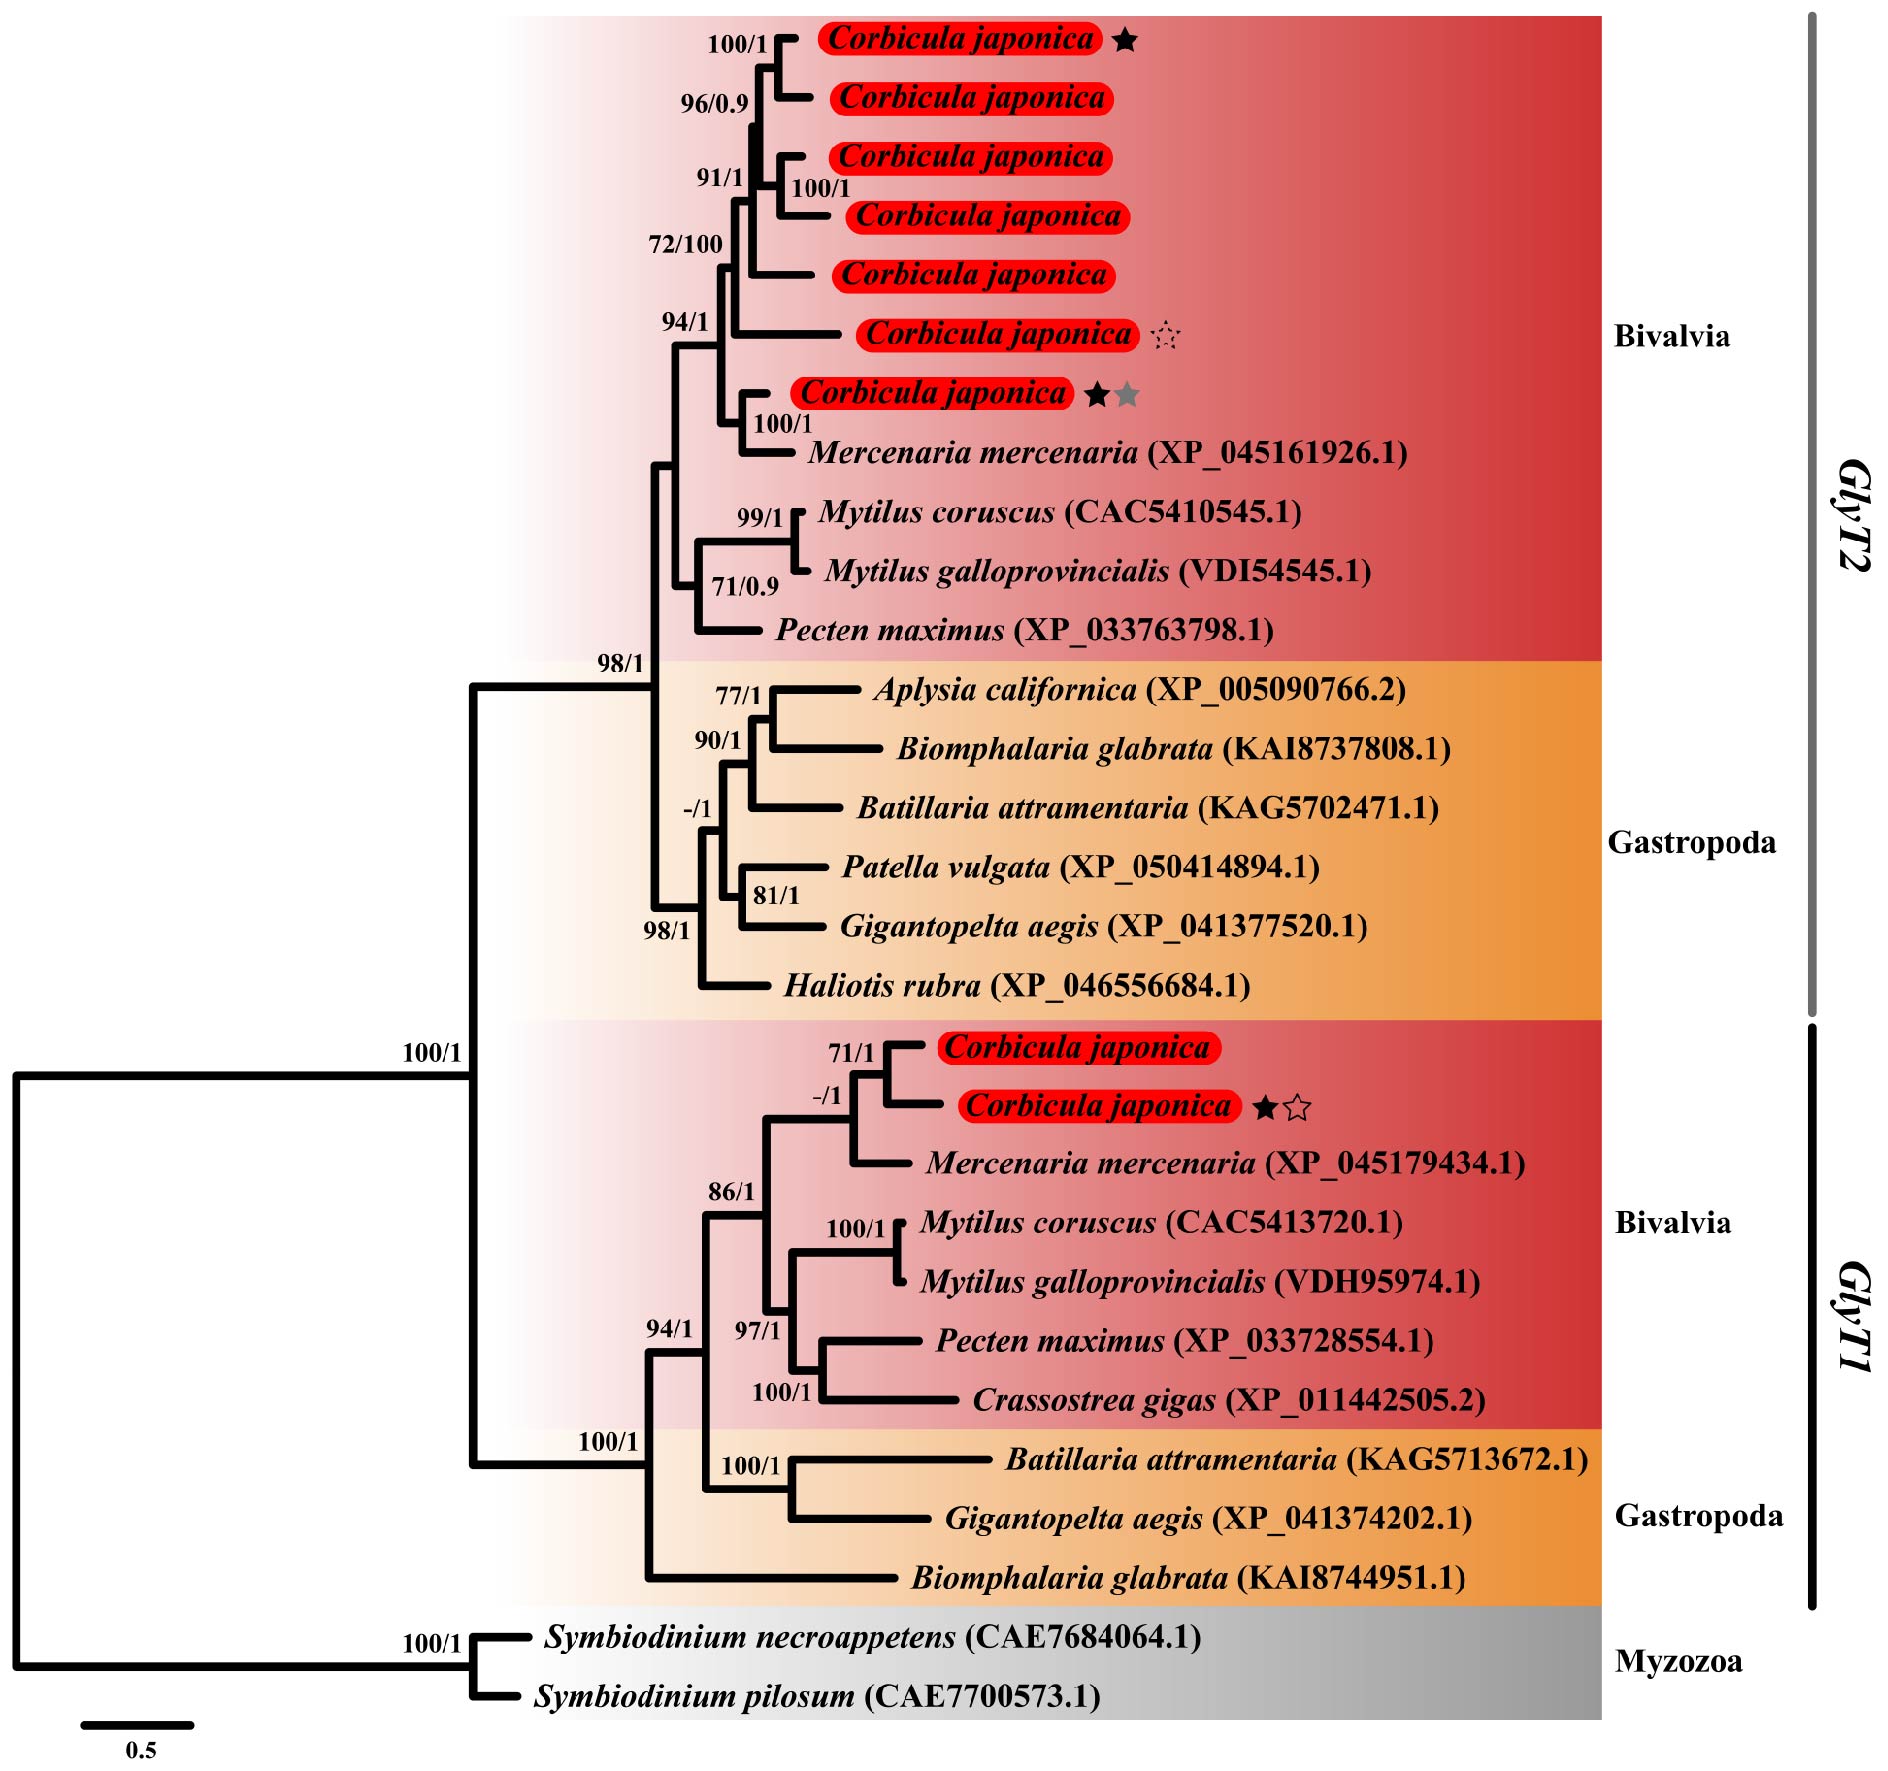
Figure S3. ML phylogeny of Sodium- and chloride-dependent glycine transporter (GlyT1, SLC6A9, and GlyT2, SLC6A5) genes. The branches with the bootstrap support values higher than 60% and Bayesian inference (BI) posterior probabilities greater than 0.6 are shown at each node. A substitution model of LG + I + G4 was used to construct ML and BI trees. Myzozoan species were used as an outgroup. Two copies of GlyT1 and seven copies of GlyT2 genes in the genome of Corbicula japonica were found. The brackishwater clam is highlighted in red. Genes identified as upregulated in high salinity group, upregulated in low salinity group, used for staining, and duplicated, were indicated with black, dashed, grey, and empty stars, respectively.
Figure S4. ML phylogeny of Glutamine synthetase (GS) genes. The branches with support values higher than 60% and Bayesian inference (BI) posterior probabilities greater than 0.6 are shown at each node. A substitution model of LG + I + G4 was used to construct ML and BI trees. Fungal species were used as an outgroup. Three copies of GS genes in the genome of Corbicula japonica were found. The brackishwater clam is highlighted in red. Genes identified as upregulated in high salinity group and used for staining were indicated with black and grey stars, respectively.
Figure S5. ML phylogenetic analysis of Cation-chloride cotransporter 6 (CCC6, SLC12A9) genes. The branches with support values higher than 60% and Bayesian inference (BI) posterior probabilities greater than 0.6 are shown at each node. A substitution model of LG + F + I + G4 was used to construct ML and BI trees. Fungal species were used as an outgroup. The brackishwater clam is highlighted in red.
Figure S6. ML phylogenetic analysis of Alanine-glyoxylate aminotransferase (AGXT), gene. The branches with the bootstrap support values higher than 60% and Bayesian inference (BI) posterior probabilities greater than 0.6 are shown at each node. A substitution model of LG+ F + I + G4 was used to construct ML and BI trees. Fungal species were used as an outgroup. The brackishwater clam is highlighted in red. Upregulated gene in high salinity group was indicated with black star.
Figure S7. ML phylogenetic analysis of Na+/K+-ATPase subunit (NKA-a) gene. The branches with the bootstrap support values higher than 60% and Bayesian inference (BI) posterior probabilities greater than 0.6 are shown at each node. A substitution model of LG+ F + I + G4 was used to construct ML and BI trees. Fungal species was used as an outgroup. The brackishwater clam is highlighted in red. Two copies of NKA-a genes in the genome of Corbicula japonica were found. Genes identified as upregulated in high salinity were indicated with black stars.
Figure S8. ML phylogeny of GABA transporter (GAT1, SLC6A1 and GAT2, SLC6A13) genes. The branches with bootstrap support values higher than 60% and Bayesian inference (BI) posterior probabilities greater than 0.6 are shown at each node. A substitution model of LG + I + G4 was used to construct ML and BI trees. Fungal spcies were used as an outgroup. The brackishwater clam is highlighted in red. The genes identified as upregulated in high salinity group and used for staining were indicated with a black and grey star, respectively.
Figure S9. ML phylogeny of Potassium voltage-gated channel subfamily KQT member 1 (KCNQ1) genes. The branches with support values higher than 60% and Bayesian inference (BI) posterior probabilities greater than 0.6 are shown at each node. A substitution model of JTT + I + G4 was used to construct ML and BI trees. Cnidarian species were used as an outgroup. The brackishwater clam is highlighted in red. Upregulated gene in high salinity group was marked with a black star.
Figure S10. ML phylogeny of Calcium-dependent membrane-binding protein (CPNE8) genes. The branches with support values higher than 60% and Bayesian inference (BI) posterior probabilities greater than 0.6 are shown at each node. A substitution model of LG + F + I + G4 was used to construct ML and BI trees. Fungal species were used as an outgroup. The brackishwater clam is highlighted in red. Upregulated gene in high salinity group was marked with a black star.
Figure S11. ML phylogeny of Excitatory amino acid transporter (EAAT1 SLC1A3 and EAAT3, SLC1A1) genes. The branches with the bootstrap support values higher than 60% and Bayesian inference (BI) posterior probabilities greater than 0.6 are shown at each node. A substitution model of LG + F + I + G4 was used to construct ML and BI trees. Fungal species were used as an outgroup. The brackishwater clam is highlighted in red. Upregulated gene in high salinity group was marked with a black star.
Figure S12. ML phylogenetic analysis of Sodium-dependent multivitamin transporter (SMVT, SLC5A6) genes. The branches with support values higher than 60% and Bayesian inference (BI) posterior probabilities greater than 0.6 are shown at each node. A substitution model of LG + F + I + G4 was used to construct ML and BI trees. Fungal species were used as an outgroup. Two copies of SMVT genes in the genome of Corbicula japonica were found. The brackishwater clam is highlighted in red. Genes identified as upregulated in high salinity group were indicated with black stars.
Figure S13. ML phylogenetic analysis of Sodium-dependent vitamin C transporter (SVCT1, SLC23A1 and SVCT2, SLC23A2) genes. The branches with the bootstrap support values higher than 60% and Bayesian inference (BI) posterior probabilities greater than 0.6 are shown at each node. A substitution model of LG+ F + I + G4 was used to construct ML and BI trees. Zea mays was used as an outgroup. The brackishwater clam is highlighted in red. Upregulated genes in high salinity group were marked with a black star.
Table S1. The water quality assessment results for the Seomjingang River conducted by the Water Environment Information System of Korean Ministry of Environment (The database is publicly available at https://water.nier.go.kr). (excel file)
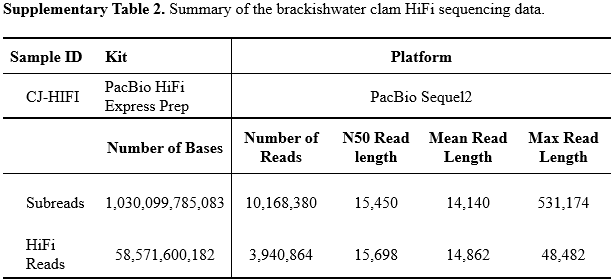
Table S2. Summary of the brackishwater clam HiFi sequencing data.
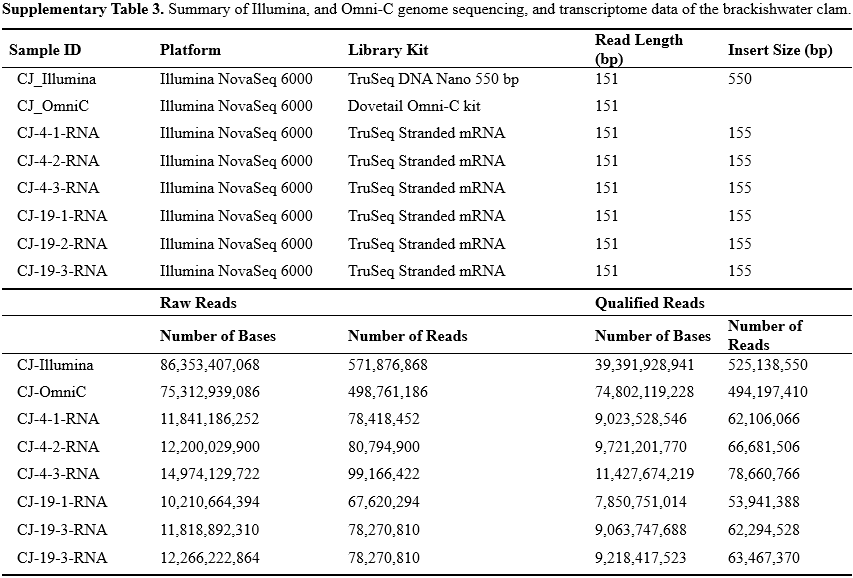
Table S3. Summary of Illumina, and Omni-C genome sequencing, and transcriptome data of the brackishwater clam.
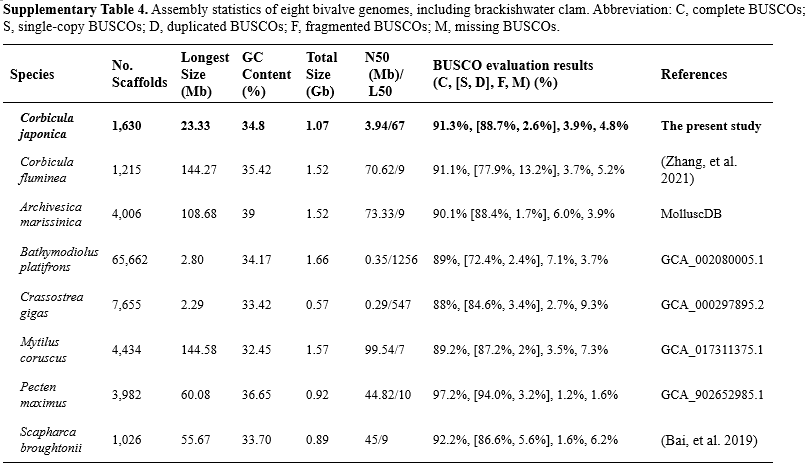
Table S4. Assembly statistics of eight bivalve genomes, including brackishwater clam. Abbreviation: C, complete BUSCOs; S, single-copy BUSCOs; D, duplicated BUSCOs; F, fragmented BUSCOs; M, missing BUSCOs.
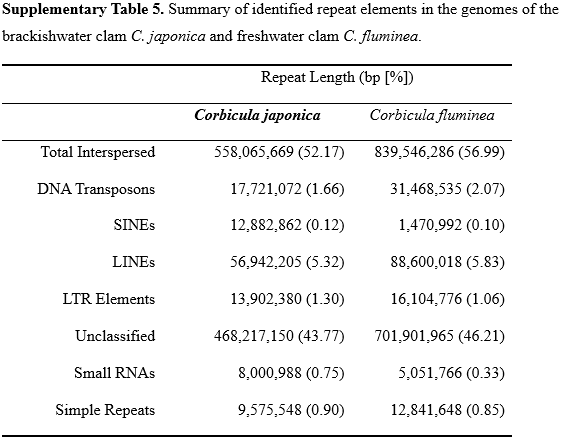
Table S5. Summary of identified repeat elements in the genomes of the brackishwater clam C. japonica and freshwater clam C. fluminea.
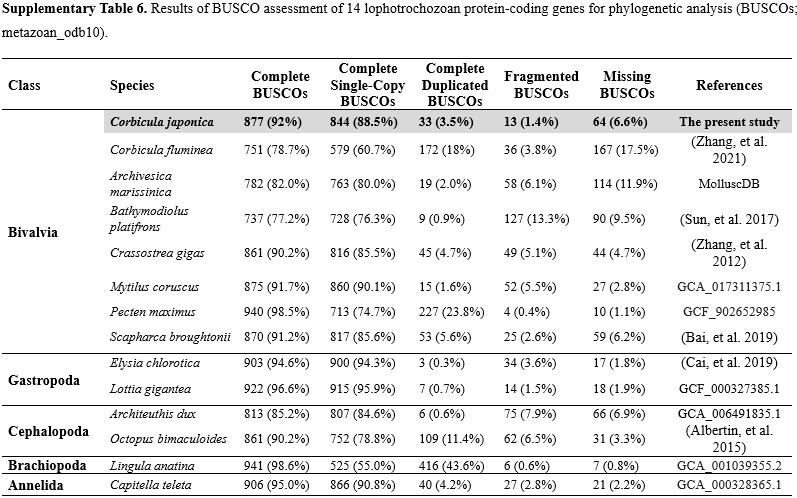
Table S6. Results of BUSCO assessment of 14 lophotrochozoan protein-coding genes for phylogenetic analysis (BUSCOs; metazoan_odb10).
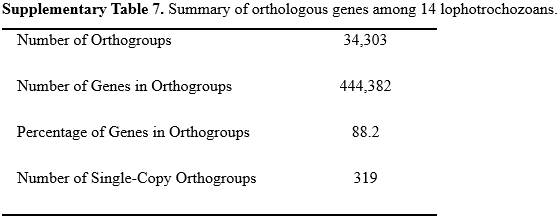
Table S7. Summary of orthologous genes among 14 lophotrochozoans.
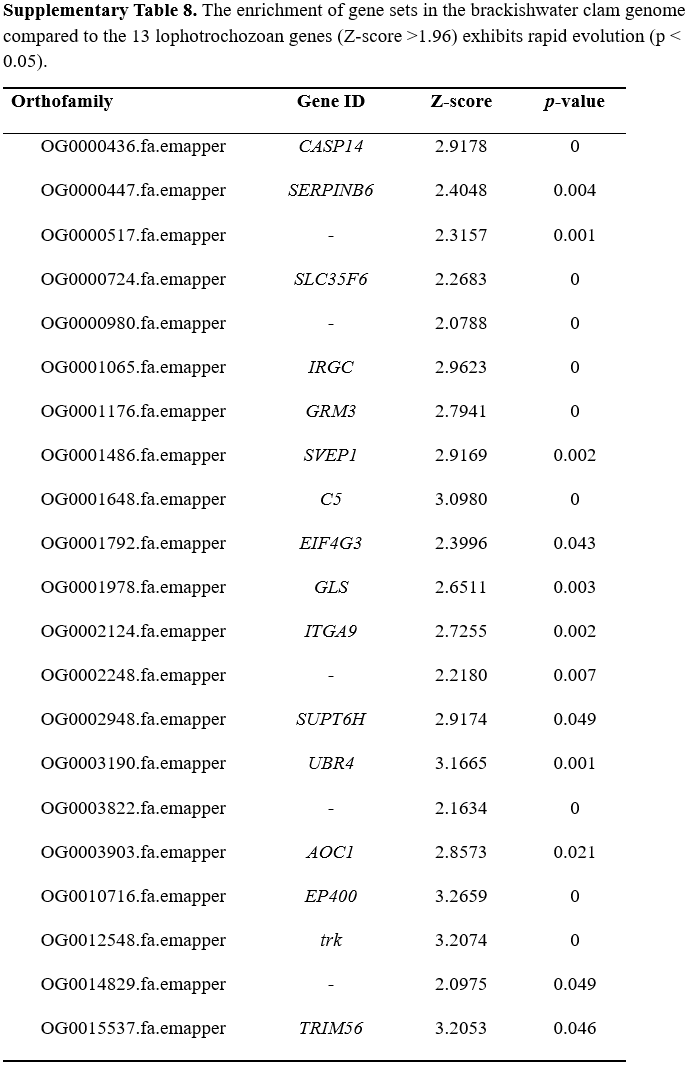
Table S8. The enrichment of gene sets in the brackishwater clam genome compared to the 13 lophotrochozoan genes (Z-score >1.96) exhibits rapid evolution (p < 0.05).
Table S9. Enriched Kyoto Encyclopedia of Genes and Genomes (KEGG) pathway in the significantly expanded gene families in brackishwater clam compared to the 13 lophotrochozoan gene families. (excel file)
Table S10. The result of differentially expressed genes (DEGs) between low salinity group (LSG, 4 ppt) and high salinity group (HSG, 19 ppt) using DESeq2 with | log2(fold change) | ≥ 2 and FDR ≤0.05. The genes that experience upregulation in HSG and LSG are placed on the right and left sides, respectively. Upregulated gene names are listed in alphabetical order: AGXT: Alanine-glyoxylate aminotransferase; AMT: Ammonia transporter; β-CA: Beta-carbonic anhydrases; BIRC: Baculoviral IAP repeat-containing; CPNE8: Calcium-dependent membrane-binding protein; EAAT3: Excitatory amino acid transporter 3; GAT2: GABA transporter 2; GlyTs: Sodium- and Chloride dependent glycine transporters; GS: Glutamine synthetase; KCNQ1: Potassium voltage-gated channel subfamily KQT member 1; MTNR: Melatonin receptor; NDCBE: Sodium-driven chloride/bicarbonate exchanger; NKA: Na+/K+-ATPase; SMVT: Sodium-dependent multivitamin transporter; SVCTs: Sodium-dependent vitamin C transporters; VNX1: Cation/H+ antiporter. (excel file)
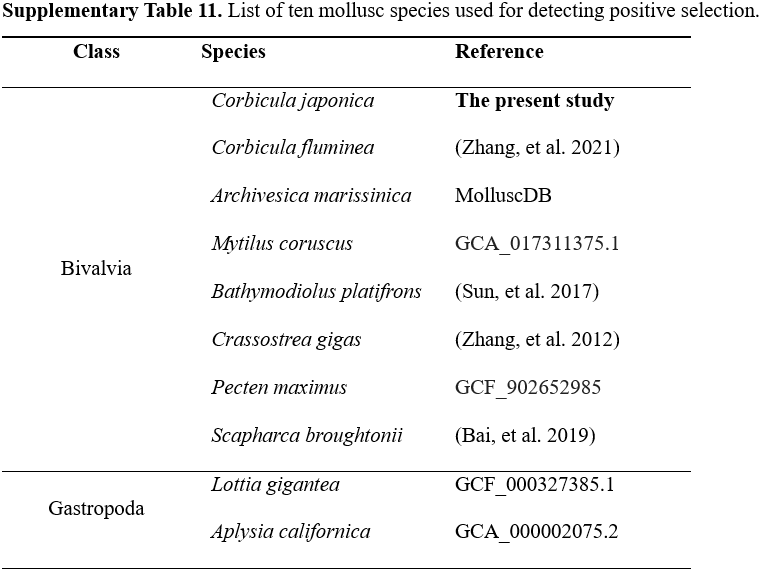
Table S11. List of ten mollusc species used for detecting positive selection.
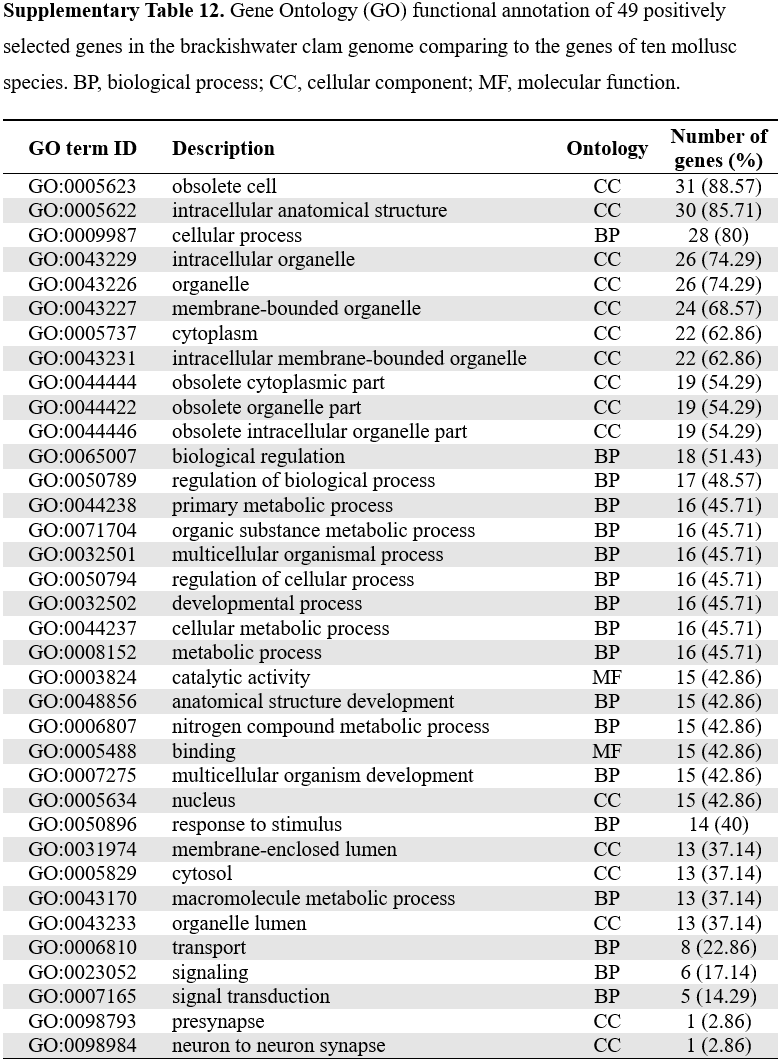
Table S12. Gene Ontology (GO) functional annotation of 49 positively selected genes in the brackishwater clam genome comparing to the genes of ten mollusc species. BP, biological process; CC, cellular component; MF, molecular function.
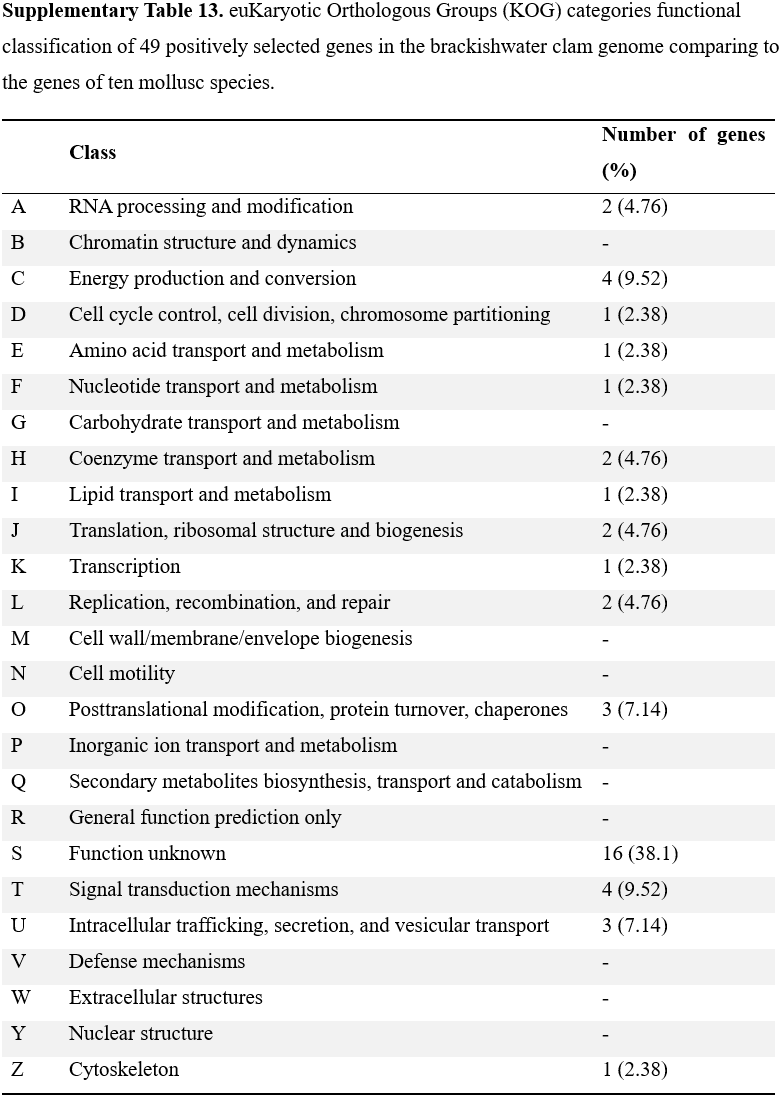
Table S13. euKaryotic Orthologous Groups (KOG) categories functional classification of 49 positively selected genes in the brackishwater clam genome comparing to the genes of ten mollusc species.
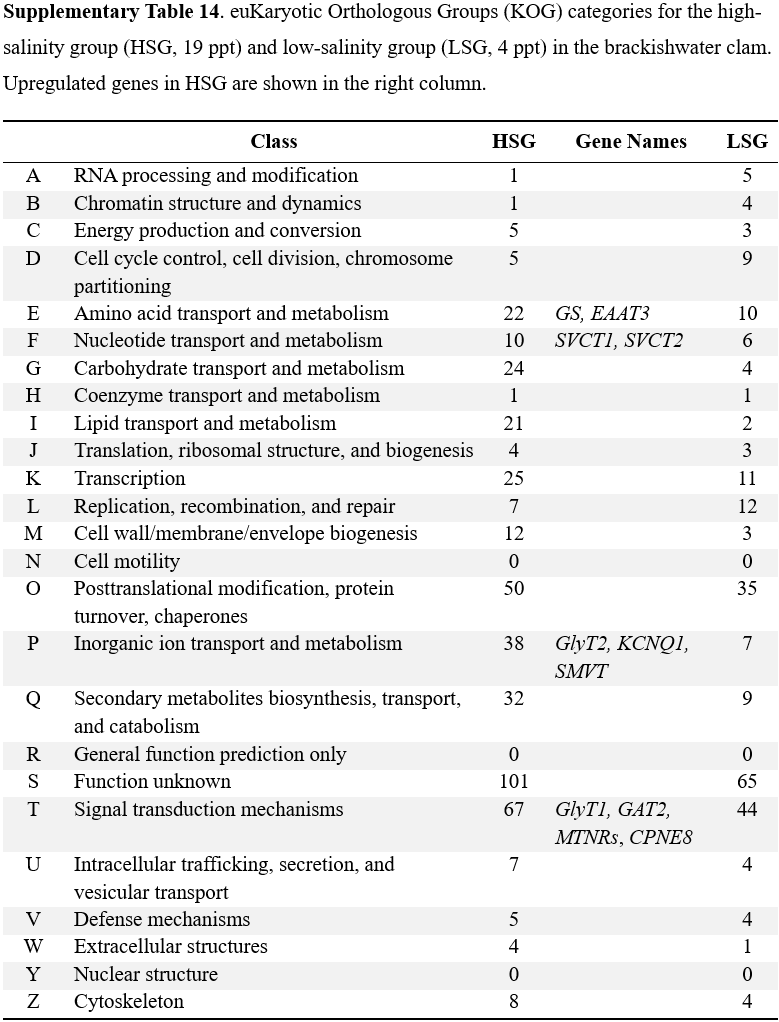
Table S14. euKaryotic Orthologous Groups (KOG) categories for the high-salinity group (HSG, 19 ppt) and low-salinity group (LSG, 4 ppt) in the brackishwater clam. Upregulated genes in HSG are shown in the right column.
Table S15. Gene Ontology (GO) enrichment analysis in the high-salinity group (HSG, 19 ppt), relative to the control group (LSG, 4 ppt), in brackishwater clam experimental treatments. BP, biological process; CC, cellular component.(excel file)